## Diagram: Task 7e0986d6 - Input/Output Configuration Comparison
### Overview
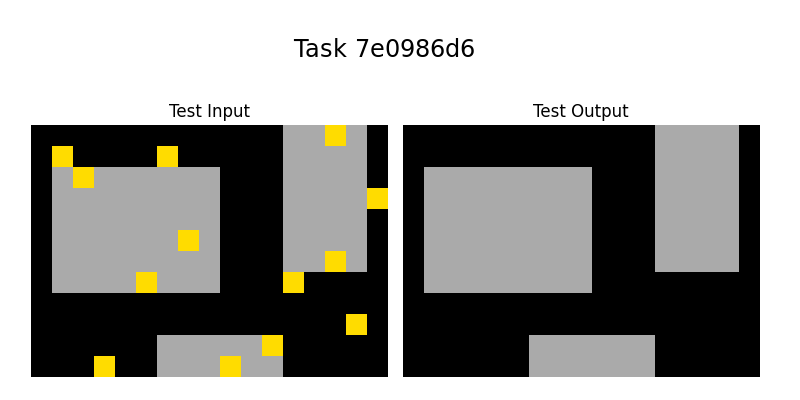
The image presents a side-by-side comparison of two configurations labeled "Test Input" (left) and "Test Output" (right). Both sections use a grid-based layout with colored geometric shapes (gray rectangles and yellow squares) against a black background. No numerical data or axes are present.
### Components/Axes
- **Title**: "Task 7e0986d6" (centered at the top).
- **Labels**:
- "Test Input" (above the left grid).
- "Test Output" (above the right grid).
- **Visual Elements**:
- **Test Input**:
- 3 large gray rectangles (positions: top-left, top-right, bottom-center).
- 8 small yellow squares distributed across the grid (e.g., clustered near gray rectangles).
- **Test Output**:
- 3 large gray rectangles (positions: top-left, top-right, bottom-center).
- No yellow squares present.
### Detailed Analysis
- **Test Input**:
- Gray rectangles are smaller and irregularly spaced.
- Yellow squares are scattered, with some overlapping gray rectangles and others isolated.
- **Test Output**:
- Gray rectangles are larger and more uniformly spaced.
- No yellow squares remain; all yellow elements from the input are absent.
### Key Observations
1. **Structural Transformation**: The output configuration simplifies the input by removing yellow squares and enlarging gray rectangles.
2. **Positional Consistency**: The placement of gray rectangles remains consistent between input and output (top-left, top-right, bottom-center).
3. **Color Coding**: Yellow squares in the input likely represent distinct entities (e.g., data points, nodes) that are consolidated or removed in the output.
### Interpretation
The diagram suggests a process of **data aggregation or simplification**. The removal of yellow squares in the output implies that secondary elements (possibly noise, outliers, or redundant data) were filtered out, while the gray rectangles (primary entities) were expanded to represent consolidated information. This could reflect a workflow step such as:
- **Data preprocessing**: Eliminating irrelevant features.
- **Hierarchical clustering**: Merging smaller clusters into larger groups.
- **Visualization optimization**: Reducing clutter for clearer representation.
The absence of a legend or explicit legend colors leaves the exact meaning of colors ambiguous, but the contrast between yellow (small, numerous) and gray (large, consolidated) strongly implies a hierarchical relationship.