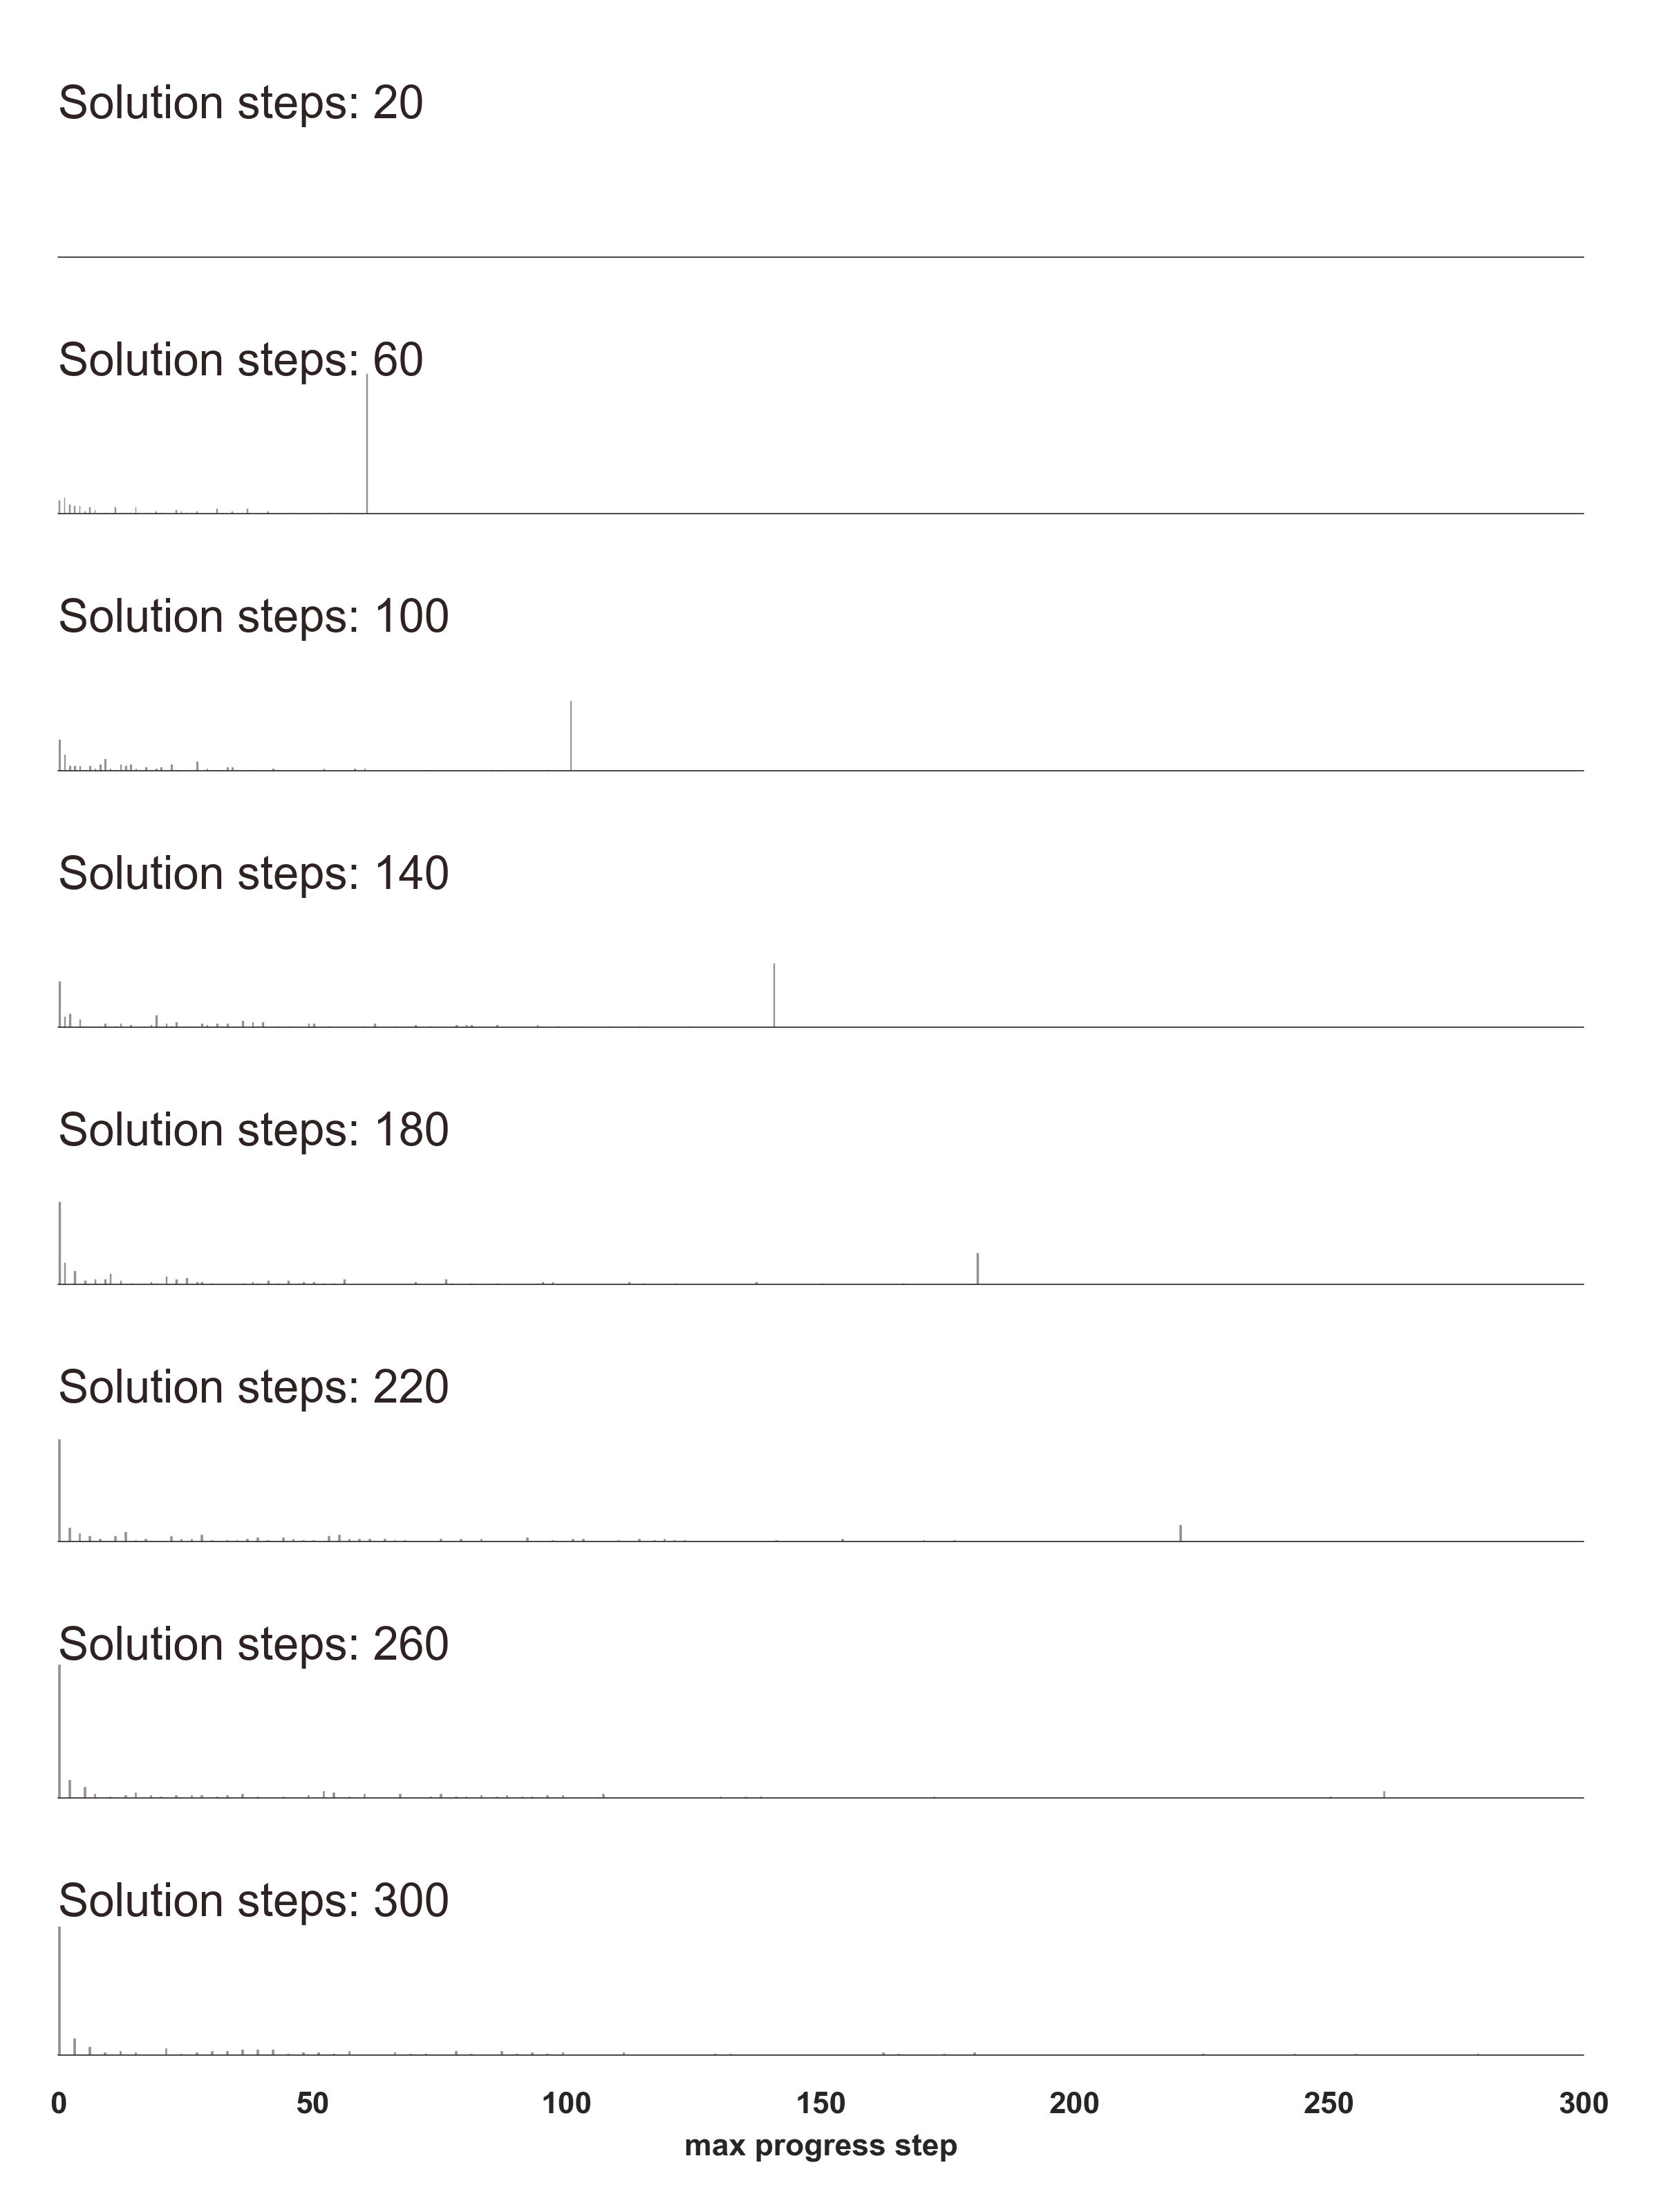
## Bar Chart: Solution Steps vs. Max Progress Step
### Overview
The image presents a series of bar charts, each representing a different number of solution steps (20, 60, 100, 140, 180, 220, 260, and 300). Each chart displays the distribution of "max progress step" values. The x-axis represents the "max progress step," ranging from 0 to 300. Each chart shows a distribution of values, with a single prominent bar indicating the most frequent "max progress step" for that number of solution steps.
### Components/Axes
* **Y-axis:** Implicitly represents the frequency or count of each "max progress step." No explicit scale is provided, but the height of the bars indicates relative frequency.
* **X-axis:** "max progress step," ranging from 0 to 300, with tick marks at intervals of 50 (0, 50, 100, 150, 200, 250, 300).
* **Labels:** Each chart is labeled with "Solution steps: [Number]", where the number varies from 20 to 300 in increments of 40.
### Detailed Analysis
Each chart represents a different number of solution steps. The charts are arranged vertically, with the number of solution steps increasing from top to bottom.
* **Solution steps: 20:** A small number of bars are present near the 0 mark.
* **Solution steps: 60:** A single prominent bar is present at approximately x = 50.
* **Solution steps: 100:** A single prominent bar is present at approximately x = 100.
* **Solution steps: 140:** A single prominent bar is present at approximately x = 150.
* **Solution steps: 180:** A single prominent bar is present at approximately x = 150.
* **Solution steps: 220:** A single prominent bar is present at approximately x = 0.
* **Solution steps: 260:** A single prominent bar is present at approximately x = 0.
* **Solution steps: 300:** A small number of bars are present near the 0 mark.
### Key Observations
* As the number of solution steps increases from 20 to 180, the "max progress step" tends to increase.
* For solution steps 220 and 260, the "max progress step" is concentrated at 0.
* For solution steps 20 and 300, the "max progress step" is concentrated at 0.
### Interpretation
The charts suggest a relationship between the number of solution steps and the "max progress step." Initially, as the number of solution steps increases, the "max progress step" also tends to increase, indicating that more progress is being made with more steps. However, beyond a certain point (around 180 solution steps), the "max progress step" appears to decrease, with the majority of progress concentrated at 0 for 220 and 260 solution steps. This could indicate a point of diminishing returns or a change in the behavior of the solution process. The behavior at 20 and 300 solution steps is similar, with the "max progress step" concentrated at 0. This could indicate that the solution process is not effective at these extremes.