TECHNICAL ASSET FINGERPRINT
5f1887ccb46298e0e5d7e3ed
Click to view fullscreen
Press ESC or click to close
FOUND IN PAPERS
EXPERT: gemini-2.5-flash-free VERSION 1
RUNTIME: google-free/gemini-2.5-flash
INTEL_VERIFIED
## Chart Type: Series of Histograms - Distribution of Max Progress Step
### Overview
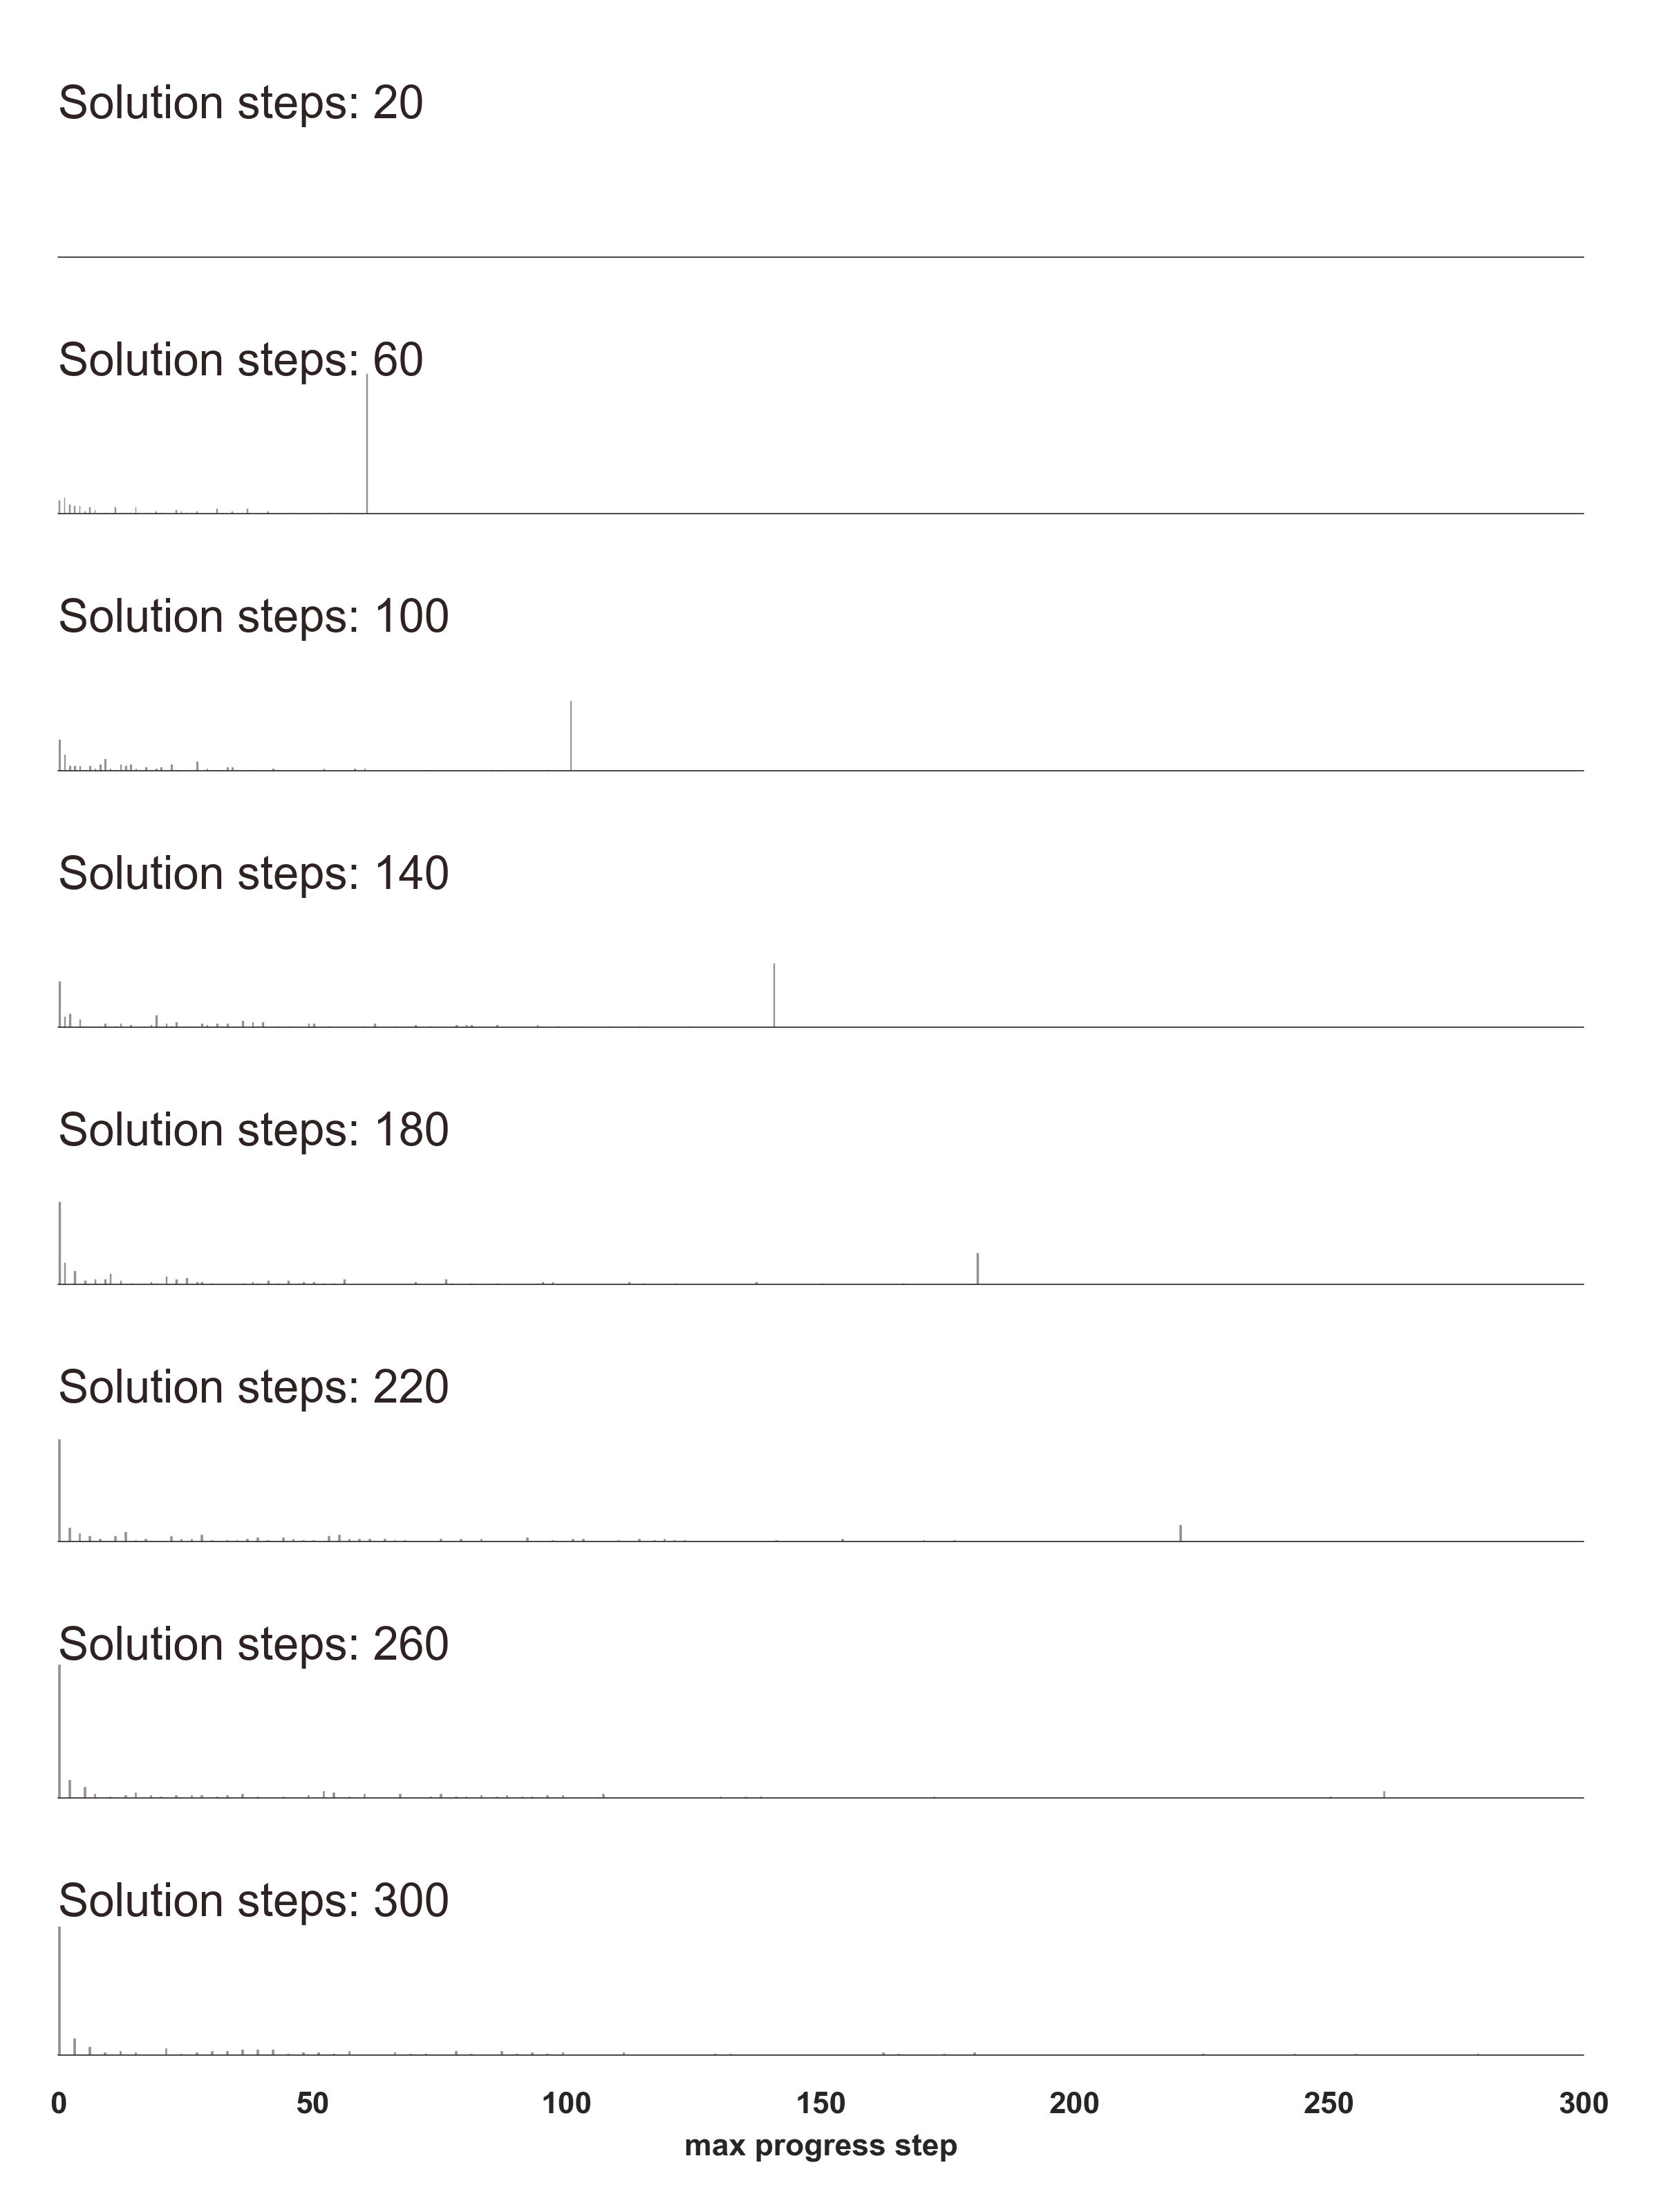
This image presents a series of eight vertically stacked histograms or bar charts. Each chart illustrates the distribution of "max progress step" values for a specific "Solution steps" count. The "Solution steps" values are provided as labels on the left side of each individual chart, ranging from 20 to 300. All charts share a common horizontal axis labeled "max progress step" at the bottom. The vertical axis, though unlabeled, implicitly represents frequency or count.
### Components/Axes
* **Overall Structure**: Eight individual charts are arranged vertically, separated by thin horizontal lines.
* **X-axis (Common to all charts)**:
* **Title**: "max progress step" (positioned centrally below the lowest chart).
* **Markers**: Numerical labels are present at 0, 50, 100, 150, 200, 250, and 300. Minor tick marks are visible at intervals of approximately 10 units.
* **Y-axis (Implicit for each chart)**:
* **Title**: Not explicitly labeled, but represents frequency or count of occurrences.
* **Markers**: No numerical markers are present, but the height of the vertical bars indicates relative frequency.
* **Chart Labels (Left side of each chart)**:
* "Solution steps: 20" (topmost chart)
* "Solution steps: 60"
* "Solution steps: 100"
* "Solution steps: 140"
* "Solution steps: 180"
* "Solution steps: 220"
* "Solution steps: 260"
* "Solution steps: 300" (bottommost chart)
* **Legend**: No legend is present. All data series are represented by black vertical bars.
### Detailed Analysis
Each chart displays a distribution of vertical bars along the "max progress step" axis. The height of the bars indicates the frequency of a particular "max progress step" value.
1. **Solution steps: 20**
* **Trend**: The distribution is heavily concentrated at the very low end of the "max progress step" axis.
* **Data Points**: Bars are visible from approximately 0 to 10. The tallest bars are very close to 0, likely between 0 and 5. There is no prominent peak around x=20.
2. **Solution steps: 60**
* **Trend**: This distribution shows a bimodal or highly skewed pattern with a dominant peak.
* **Data Points**: A cluster of very small bars is present near 0 (approximately 0-10). The most prominent feature is a very tall bar located precisely at x=60. A few very small bars extend beyond 60, up to approximately 100.
3. **Solution steps: 100**
* **Trend**: Similar to the previous chart, with a dominant peak shifted to the right.
* **Data Points**: Small bars are visible near 0 (approximately 0-10). A very tall bar is located at x=100. A few very small bars extend beyond 100, up to approximately 150.
4. **Solution steps: 140**
* **Trend**: Maintains the pattern of a dominant peak corresponding to the "Solution steps" value.
* **Data Points**: Small bars are visible near 0 (approximately 0-10). A very tall bar is located at x=140. A few very small bars extend beyond 140, up to approximately 190.
5. **Solution steps: 180**
* **Trend**: The dominant peak continues to shift rightward with increasing "Solution steps".
* **Data Points**: Small bars are visible near 0 (approximately 0-10). A very tall bar is located at x=180. A few very small bars extend beyond 180, up to approximately 230.
6. **Solution steps: 220**
* **Trend**: The pattern of a primary peak at the "Solution steps" value persists.
* **Data Points**: Small bars are visible near 0 (approximately 0-10). A very tall bar is located at x=220. A few very small bars extend beyond 220, up to approximately 270.
7. **Solution steps: 260**
* **Trend**: The distribution continues to show a strong peak at the corresponding "Solution steps" value.
* **Data Points**: Small bars are visible near 0 (approximately 0-10). A very tall bar is located at x=260. A few very small bars extend beyond 260, up to approximately 300.
8. **Solution steps: 300**
* **Trend**: The dominant peak is now at the maximum value of the x-axis.
* **Data Points**: Small bars are visible near 0 (approximately 0-10). A very tall bar is located at x=300. Due to the x-axis limit, it's unclear if the distribution extends further beyond 300.
### Key Observations
* **Consistent Primary Peak**: For "Solution steps" values of 60 and above, there is a very strong, singular peak in the distribution of "max progress step" that aligns precisely with the "Solution steps" value itself (e.g., for "Solution steps: 60", the peak is at "max progress step" = 60).
* **Initial Concentration**: All charts, regardless of the "Solution steps" value, show a small cluster of low-frequency bars very close to the origin (0-10) on the "max progress step" axis.
* **Rightward Shift**: As "Solution steps" increases, the dominant peak in the "max progress step" distribution shifts consistently to the right, maintaining its alignment with the "Solution steps" value.
* **Distribution Spread**: The spread of the distribution (the range over which small bars are visible) also tends to increase with higher "Solution steps" values, extending further to the right of the main peak.
* **Outlier Behavior**: The "Solution steps: 20" chart is an outlier. Unlike the others, it does not show a prominent peak at x=20. Instead, its distribution is entirely concentrated near 0, suggesting a different behavior or outcome for very low "Solution steps" counts.
### Interpretation
This series of histograms likely illustrates the performance or outcome of an iterative process, where "Solution steps" represents the number of iterations or steps taken to find a solution, and "max progress step" represents some measure of progress achieved.
The data suggests the following:
* **Direct Correlation (for Solution steps >= 60)**: For a sufficient number of "Solution steps" (60 or more), the process consistently achieves a "max progress step" that is directly proportional to, or even equal to, the number of "Solution steps" provided. This implies an efficient or deterministic process where more steps directly lead to more progress, up to a certain point.
* **Early Stage Behavior (Solution steps = 20)**: When the "Solution steps" are very low (e.g., 20), the process might not be able to make significant progress, or it might fail to reach a meaningful "max progress step". The concentration of "max progress step" values near 0 for "Solution steps: 20" suggests that the process either terminates very early or makes minimal progress in most cases when given only 20 steps. This could indicate a minimum threshold of "Solution steps" is required for the process to function effectively or reach its intended "progress step".
* **Residual Low Progress**: The persistent presence of small bars near "max progress step" = 0 across all charts could represent instances where the process failed immediately, encountered an error, or made no progress despite the allocated "Solution steps".
* **Potential for Over-shooting/Variability**: The small bars extending beyond the main peak (e.g., for "Solution steps: 60", bars up to 100) might indicate some variability or "over-shooting" in the "max progress step" achieved, or perhaps represent different scenarios where the process continues to make minor progress even after reaching the "Solution steps" count. However, the dominance of the main peak suggests these are less frequent occurrences.
In essence, the data demonstrates a strong relationship between the number of "Solution steps" and the "max progress step" achieved, with a clear threshold or different operational mode at very low "Solution steps" counts. The process appears to be highly effective and predictable once a certain number of steps are provided.
DECODING INTELLIGENCE...