\n
## Chart: Progress Visualization
### Overview
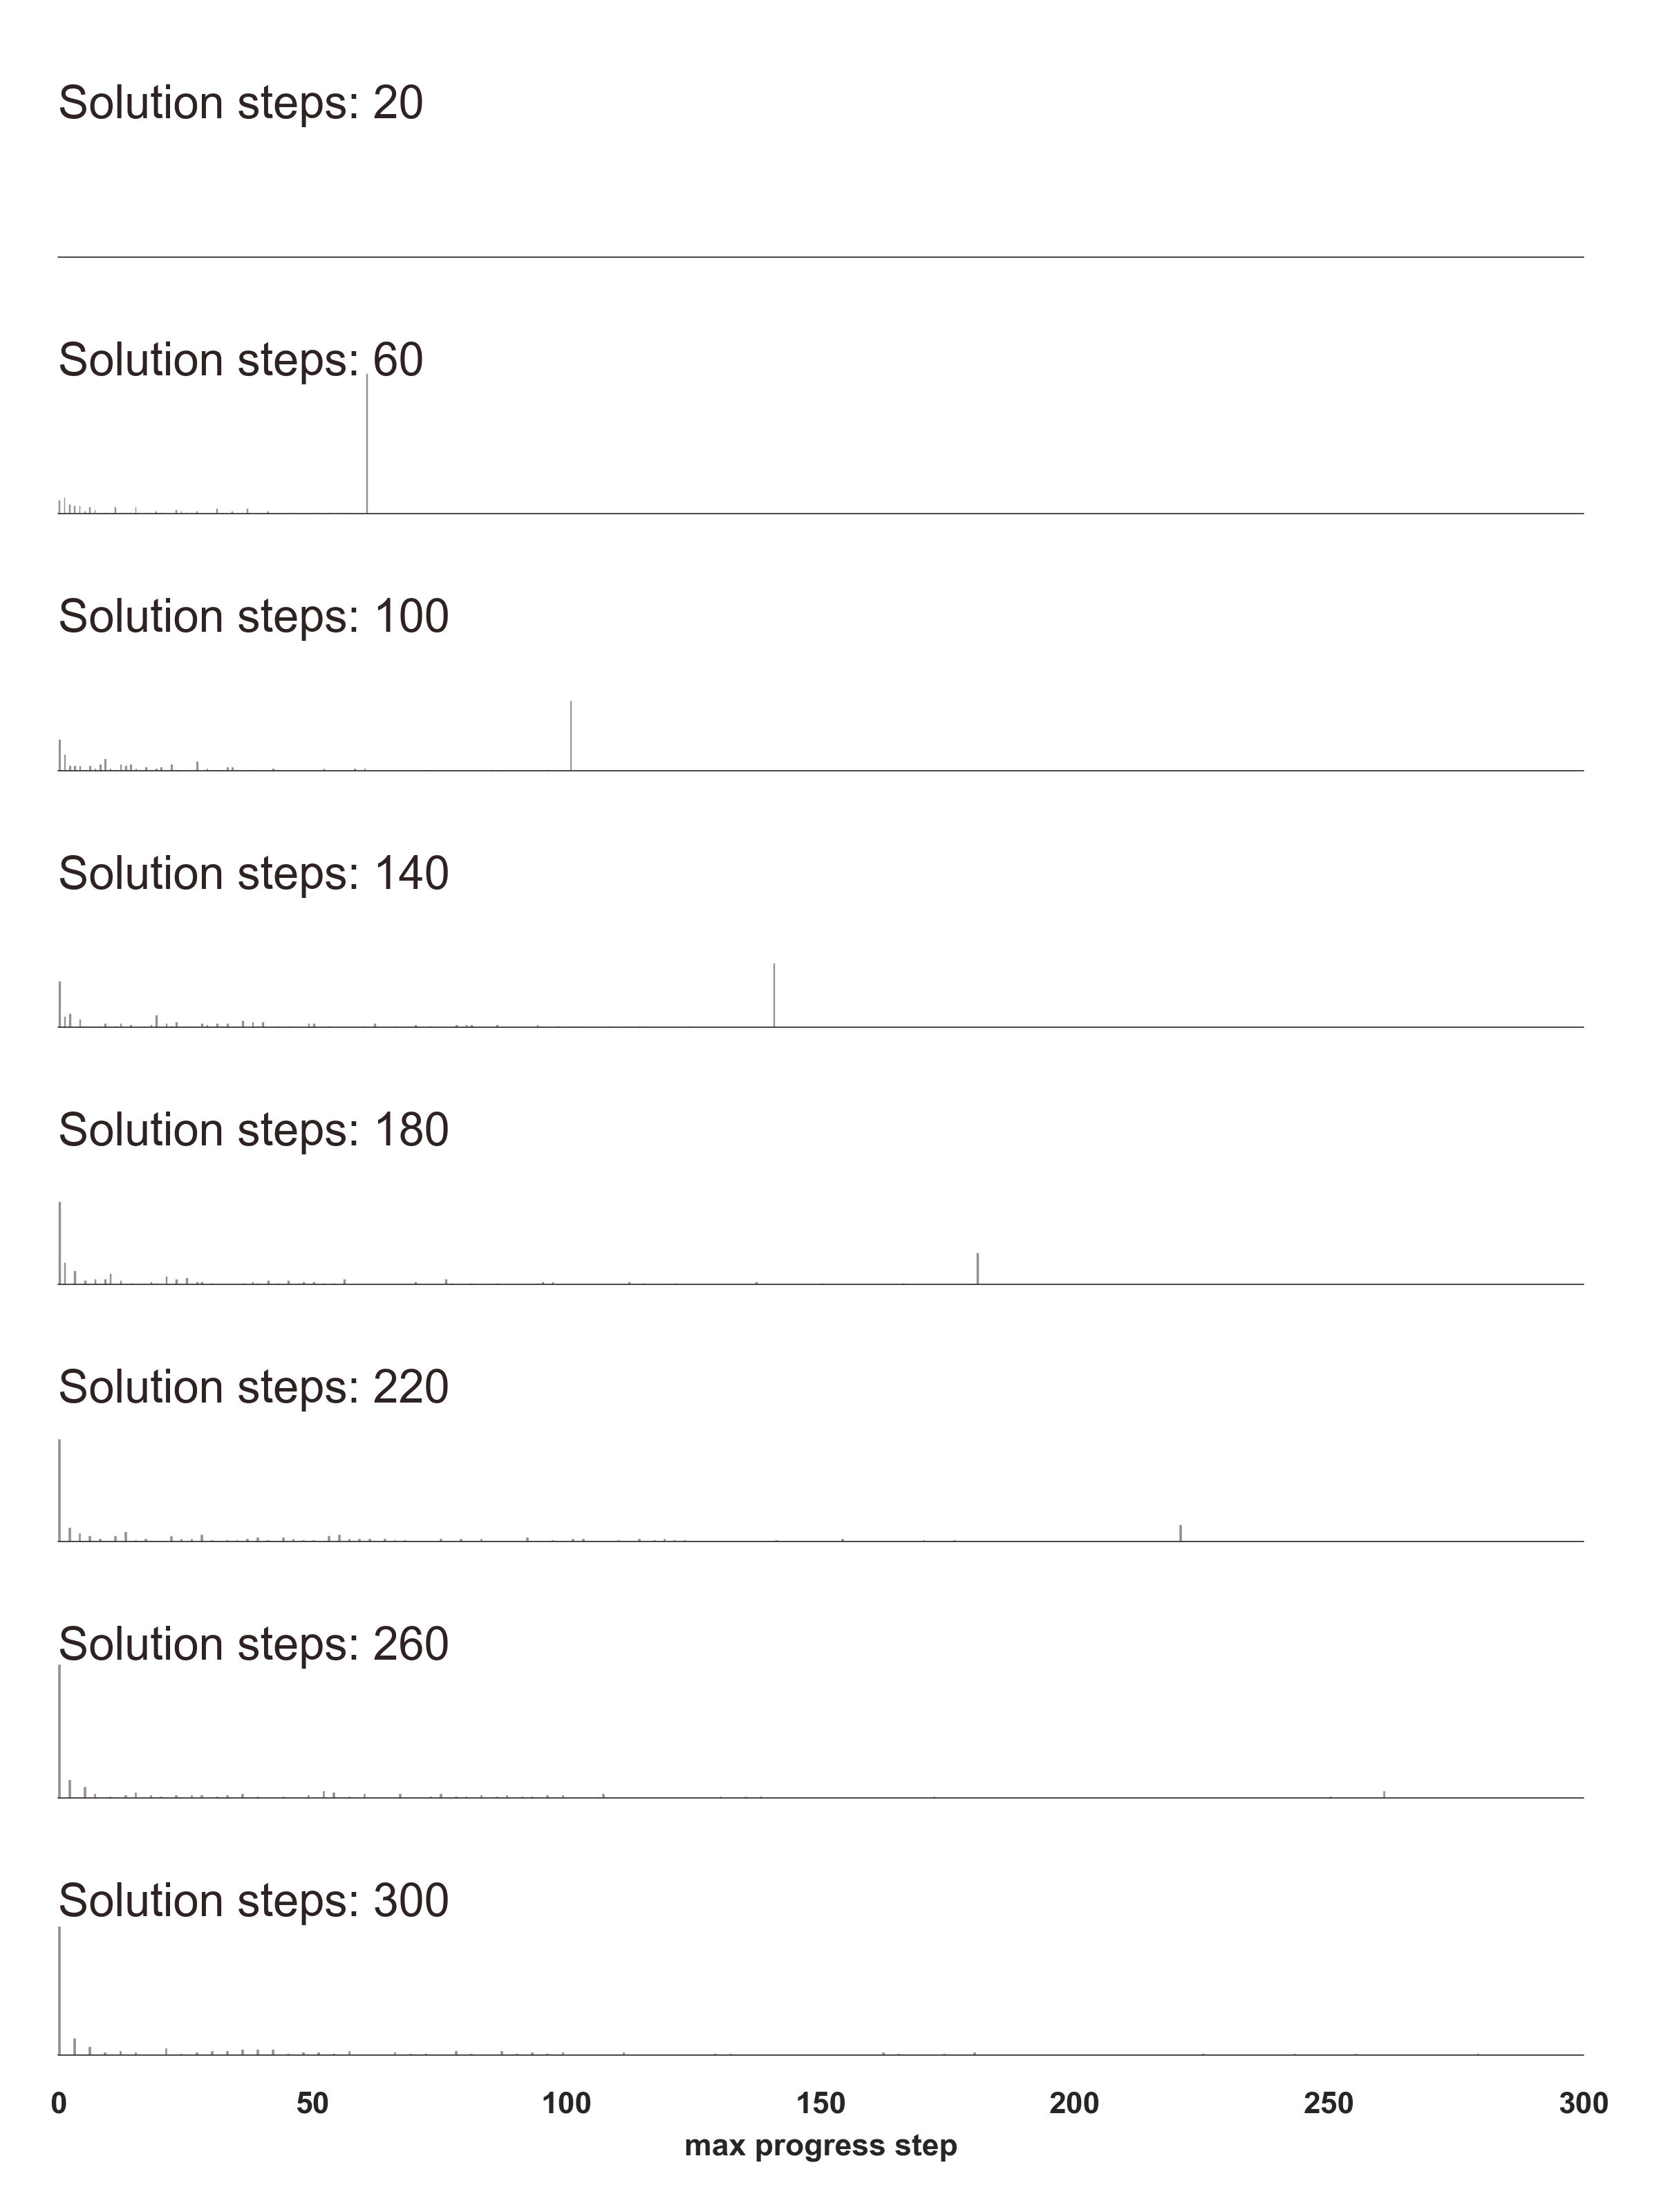
The image presents a chart visualizing progress across solution steps, ranging from 20 to 300. The chart consists of horizontal bars representing the progress at specific solution step milestones. The x-axis represents the "max progress step" and the y-axis implicitly represents the solution step number.
### Components/Axes
* **X-axis:** "max progress step" ranging from 0 to 300.
* **Y-axis:** Solution steps: 20, 60, 100, 140, 180, 220, 260, 300.
* **Bars:** Horizontal bars representing progress at each solution step. The bars are of varying lengths.
### Detailed Analysis
The chart displays progress at the following solution steps:
* **Solution steps: 20:** A short horizontal bar, approximately 10 units long, starting at the 0 mark on the x-axis.
* **Solution steps: 60:** A horizontal bar, approximately 20 units long, starting around the 10 mark on the x-axis.
* **Solution steps: 100:** A horizontal bar, approximately 30 units long, starting around the 20 mark on the x-axis.
* **Solution steps: 140:** Two horizontal bars. The first is approximately 10 units long, starting around the 40 mark on the x-axis. The second is approximately 10 units long, starting around the 70 mark on the x-axis.
* **Solution steps: 180:** Three horizontal bars. The first is approximately 10 units long, starting around the 50 mark on the x-axis. The second is approximately 10 units long, starting around the 90 mark on the x-axis. The third is approximately 10 units long, starting around the 120 mark on the x-axis.
* **Solution steps: 220:** A single horizontal bar, approximately 20 units long, starting around the 130 mark on the x-axis.
* **Solution steps: 260:** Four horizontal bars. The first is approximately 10 units long, starting around the 150 mark on the x-axis. The second is approximately 10 units long, starting around the 180 mark on the x-axis. The third is approximately 10 units long, starting around the 210 mark on the x-axis. The fourth is approximately 10 units long, starting around the 240 mark on the x-axis.
* **Solution steps: 300:** Five horizontal bars. The first is approximately 10 units long, starting around the 160 mark on the x-axis. The second is approximately 10 units long, starting around the 190 mark on the x-axis. The third is approximately 10 units long, starting around the 220 mark on the x-axis. The fourth is approximately 10 units long, starting around the 250 mark on the x-axis. The fifth is approximately 10 units long, starting around the 280 mark on the x-axis.
### Key Observations
The number of horizontal bars increases as the solution steps increase, suggesting a more fragmented or detailed progress representation at higher steps. The length of the initial bars is relatively short, while the later bars show a more distributed pattern.
### Interpretation
The chart likely represents a process that becomes more complex or requires more sub-tasks as it progresses. The increasing number of bars at higher solution steps suggests that each step is broken down into smaller components. The varying lengths of the bars could indicate the amount of work or time spent on each sub-task within a given solution step. The chart doesn't provide absolute values for progress, but rather a visual representation of the distribution of effort or completion across different stages of the process. The chart is a visualization of a process that is becoming more granular as it progresses.