## Line Chart: Solution Steps vs Max Progress Step
### Overview
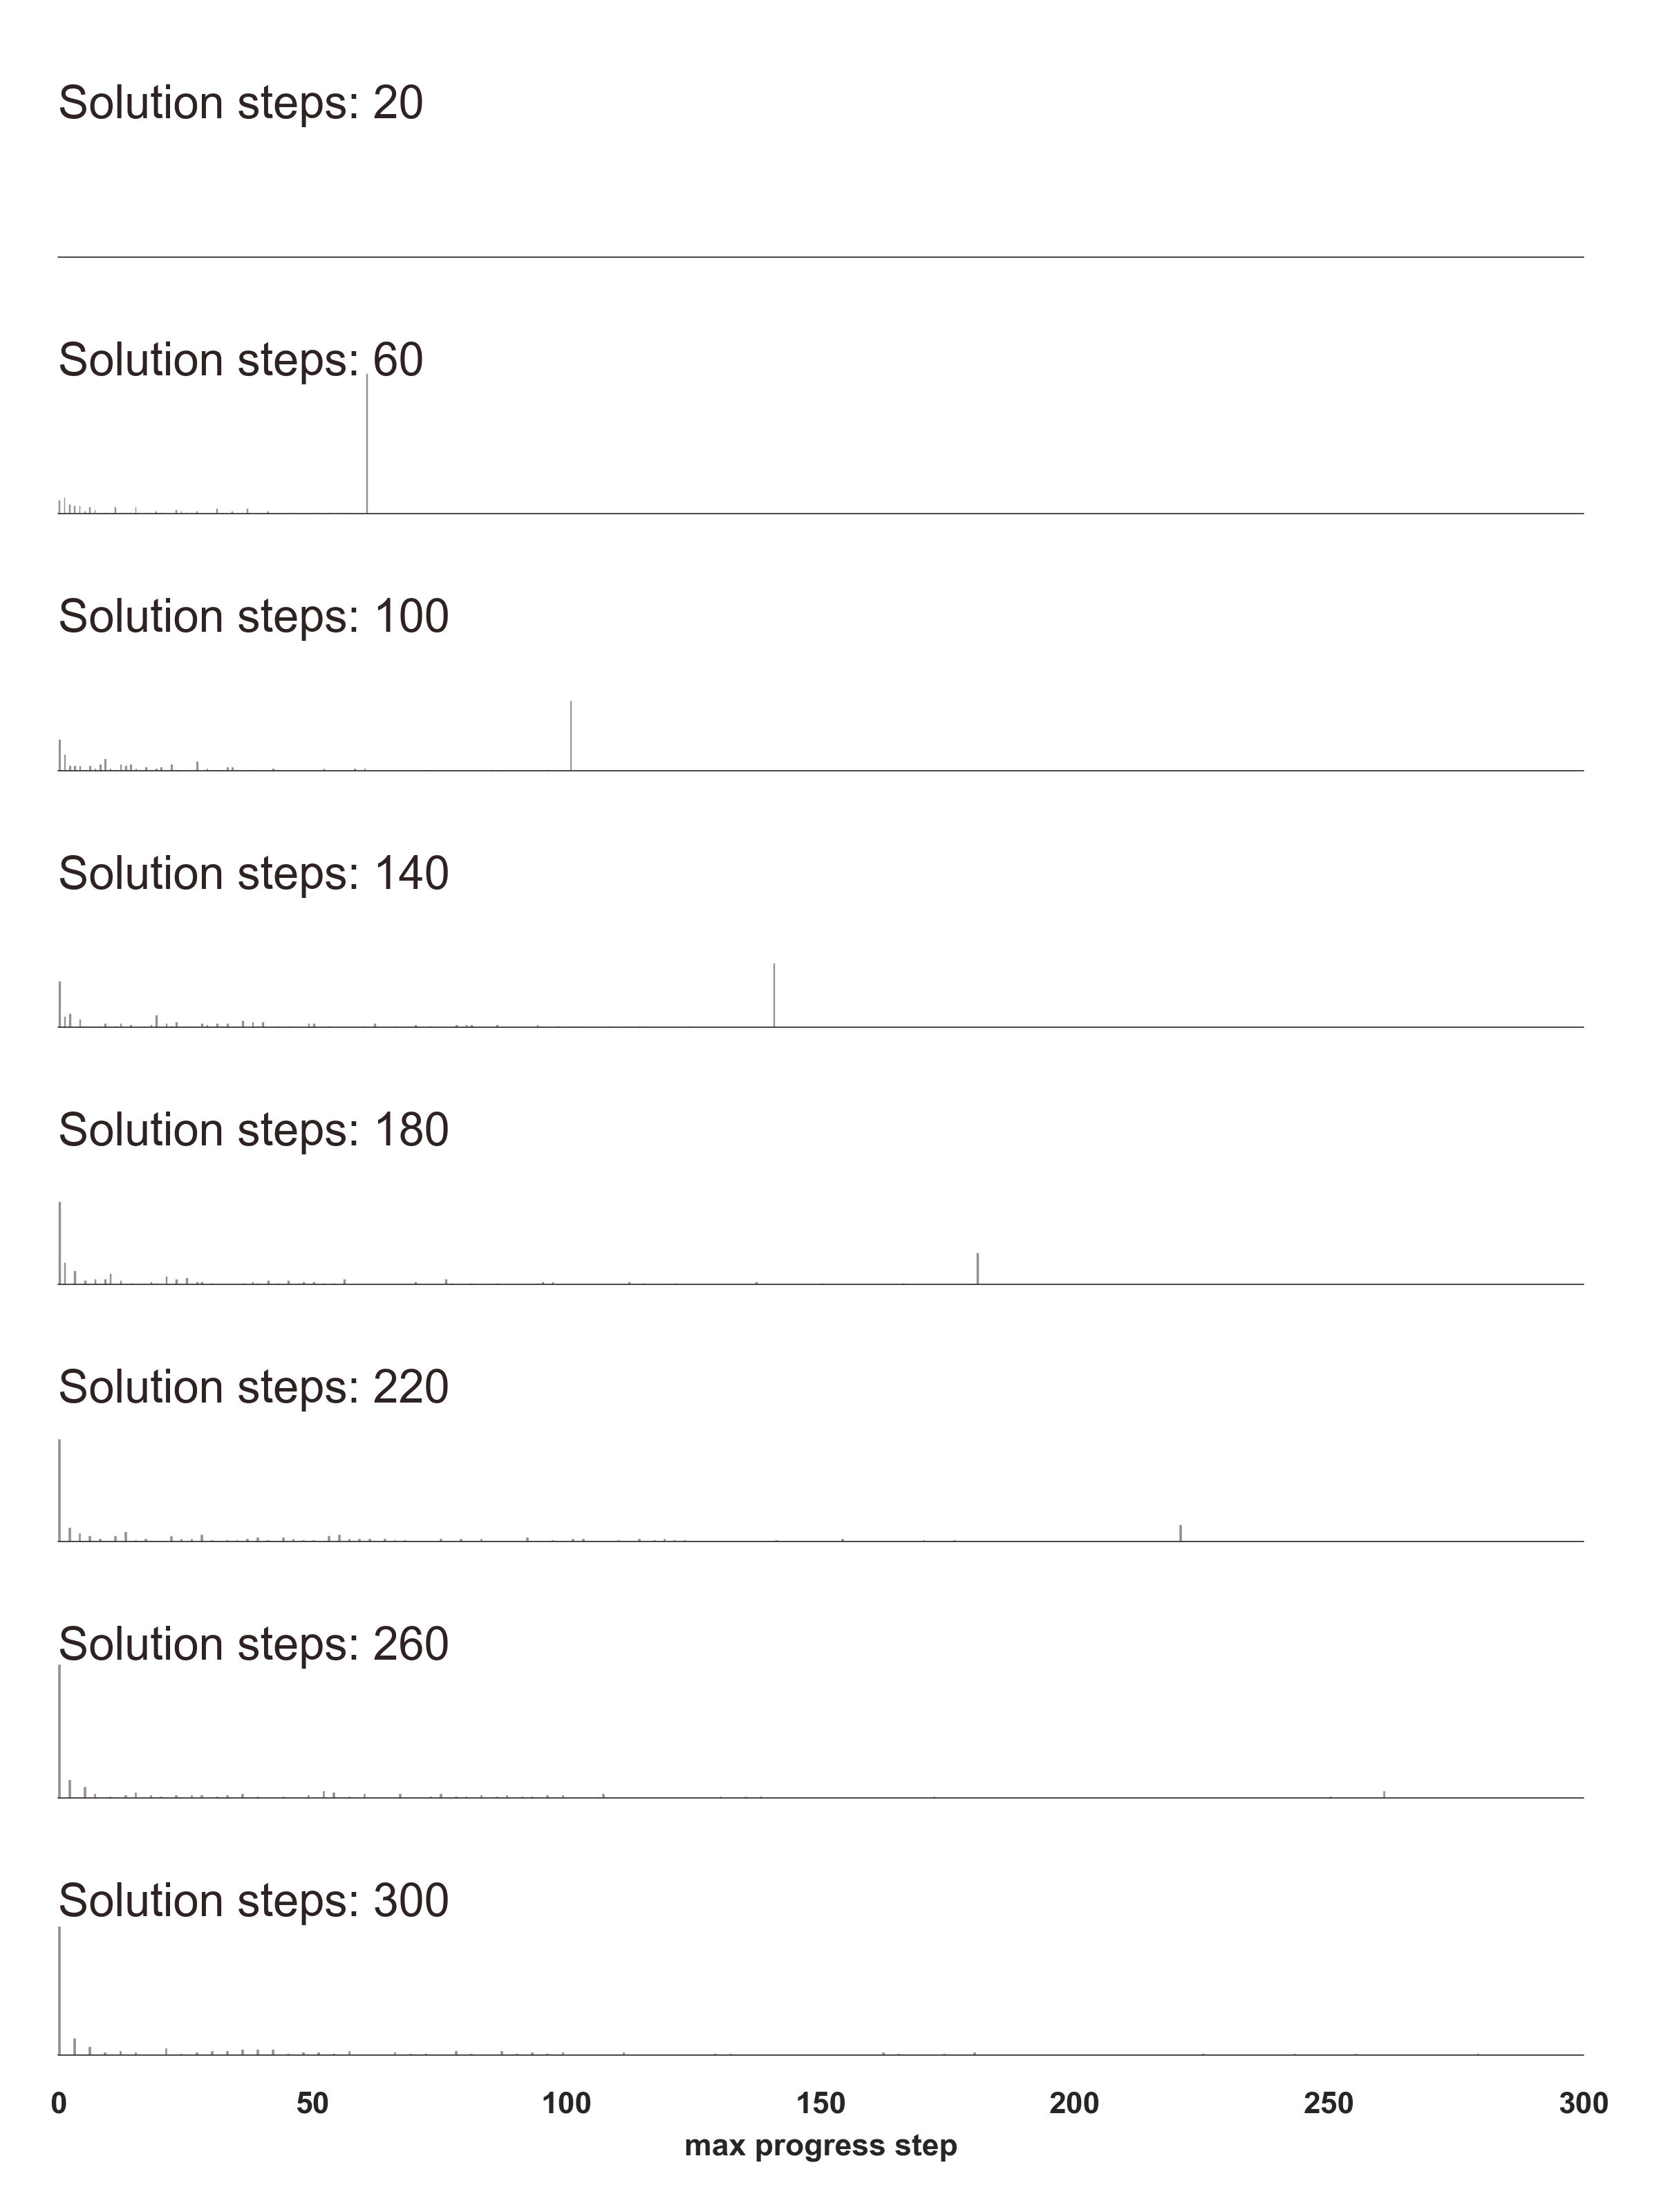
The image displays a line chart with multiple horizontal lines, each labeled with "Solution steps: X" (X = 20, 60, 100, 140, 180, 220, 260, 300). The x-axis is labeled "max progress step" (0–300), and vertical ticks are plotted along each horizontal line. The density of vertical ticks decreases as solution steps increase.
### Components/Axes
- **X-axis**: "max progress step" (0–300, increments of 50).
- **Y-axis**: Implicitly represents solution step counts (20–300, labeled at intervals).
- **Lines**: Horizontal lines for each solution step count, with vertical ticks indicating progress steps.
- **Labels**: Each line is labeled at the top with "Solution steps: X" (X = 20, 60, ..., 300).
### Detailed Analysis
- **Solution Steps 20**: Dense vertical ticks (≈30–40 ticks) concentrated near x=0–50, indicating high progress steps early.
- **Solution Steps 60**: Slightly fewer ticks (≈25–35), spread slightly further (x=0–70).
- **Solution Steps 100**: Ticks reduce to ≈20–25, spread to x=0–90.
- **Solution Steps 140**: Ticks ≈15–20, spread to x=0–110.
- **Solution Steps 180**: Ticks ≈10–15, spread to x=0–130.
- **Solution Steps 220**: Ticks ≈8–12, spread to x=0–150.
- **Solution Steps 260**: Ticks ≈5–8, spread to x=0–170.
- **Solution Steps 300**: Ticks ≈3–5, spread to x=0–190.
### Key Observations
1. **Inverse Relationship**: As solution steps increase, the number of progress steps decreases.
2. **Diminishing Returns**: The reduction in progress steps becomes less pronounced at higher solution steps (e.g., 260→300 reduces ticks by only 2–3).
3. **Progress Step Distribution**: Early progress steps (x=0–50) dominate across all solution steps, with later steps (x>100) contributing minimally.
### Interpretation
The chart suggests that increasing the number of solution steps improves efficiency in reaching the maximum progress step. However, beyond a certain point (≈180–220 solution steps), additional iterations yield minimal gains, indicating potential algorithmic saturation or diminishing returns. The dense early progress steps imply that initial iterations are critical for rapid advancement, while later steps refine the solution with less impact. This pattern could reflect optimization challenges in iterative algorithms, where early exploration drives progress, and later steps focus on fine-tuning.