# Technical Document Extraction: Image Analysis
## Figure (a)
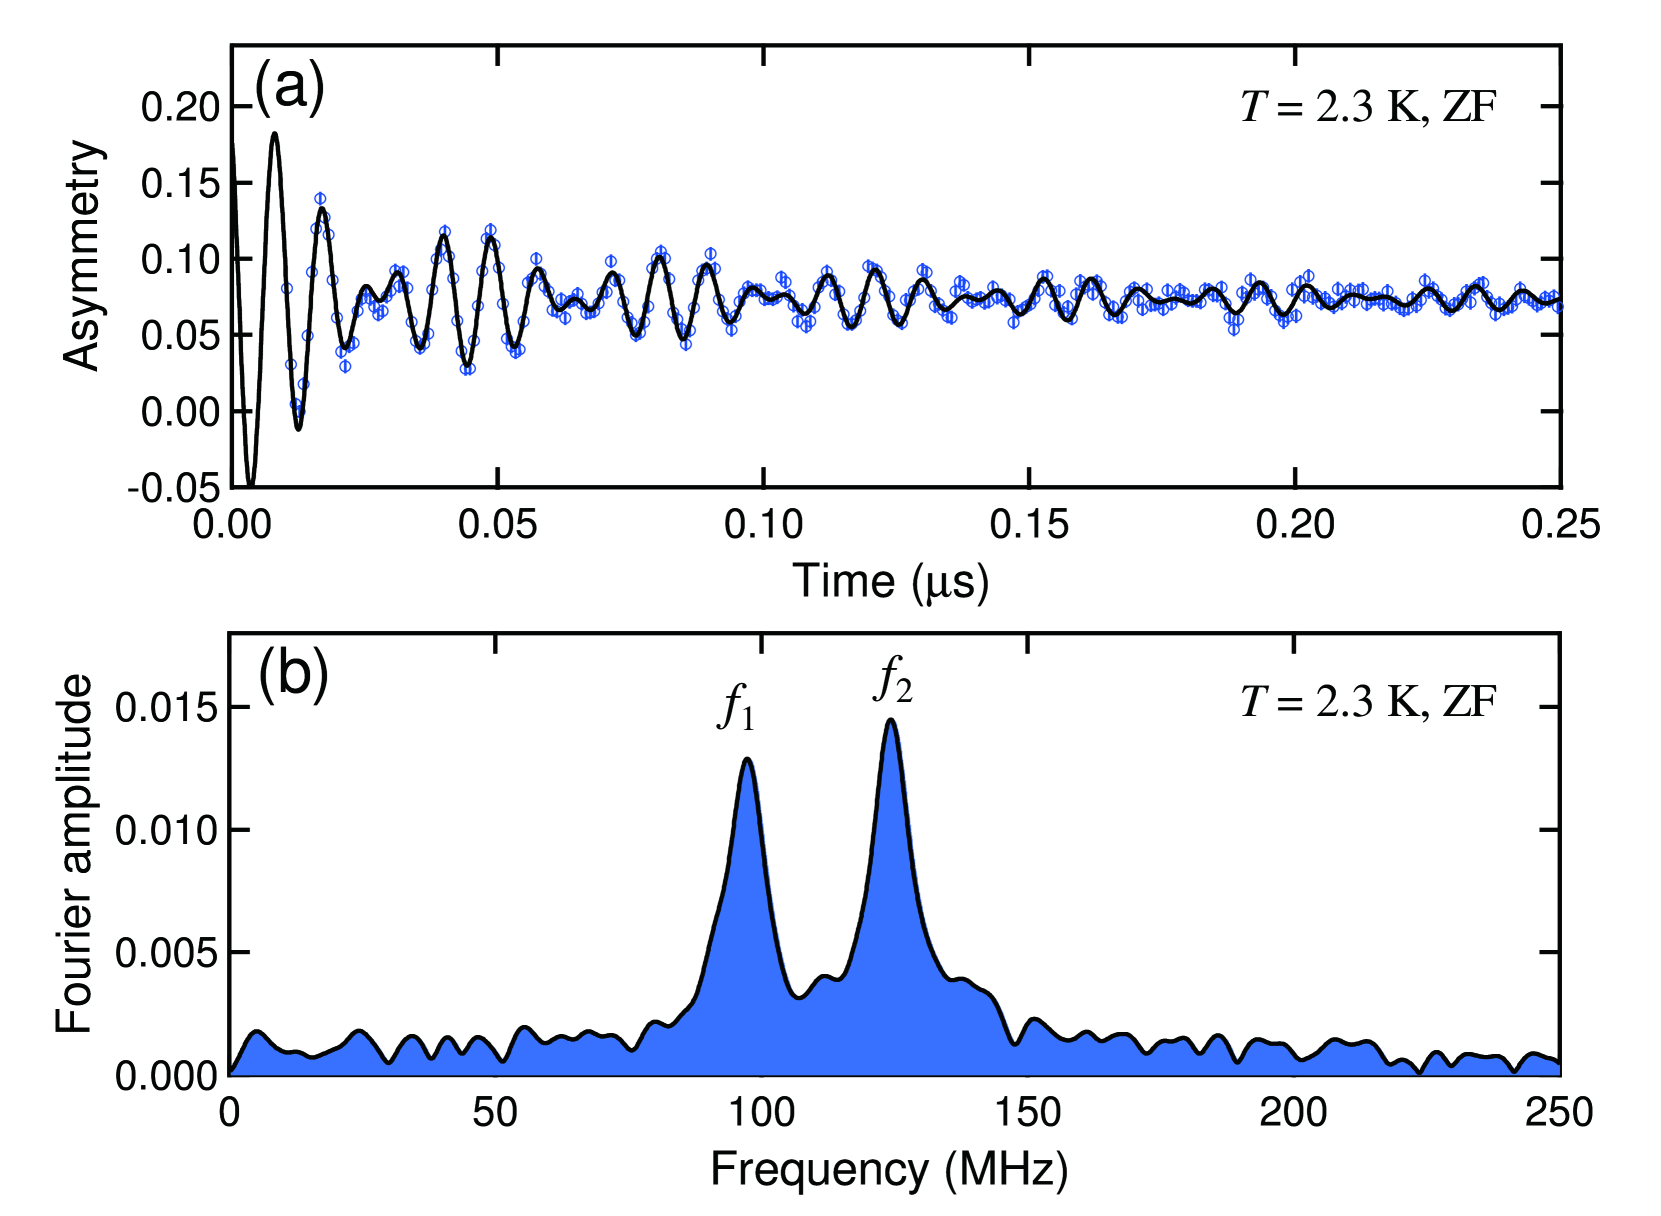
- **Title**: `T = 2.3 K, ZF` (top right corner)
- **X-axis**: `Time (μs)` with markers at `0.00`, `0.05`, `0.10`, `0.15`, `0.20`, `0.25`
- **Y-axis**: `Asymmetry` with markers at `-0.05`, `0.00`, `0.05`, `0.10`, `0.15`, `0.20`
- **Data Representation**:
- **Black Line**: Oscillatory waveform with amplitude peaks and troughs.
- **Blue Circles**: Data points overlaid on the black line, showing minor deviations from the trend.
- **Key Trends**:
- Initial sharp asymmetry spike near `0.00 μs` (y ≈ 0.20).
- Periodic oscillations with decreasing amplitude over time.
- Stabilization near `0.05–0.10` asymmetry range after `0.10 μs`.
## Figure (b)
- **Title**: `T = 2.3 K, ZF` (top right corner)
- **X-axis**: `Frequency (MHz)` with markers at `0`, `50`, `100`, `150`, `200`, `250`
- **Y-axis**: `Fourier amplitude` with markers at `0.000`, `0.005`, `0.010`, `0.015`
- **Data Representation**:
- **Blue Shaded Peaks**:
- **f₁**: Dominant peak at `~100 MHz` with amplitude `~0.012`.
- **f₂**: Secondary peak at `~150 MHz` with amplitude `~0.010`.
- **Background Noise**: Low-amplitude fluctuations across the frequency range.
- **Key Trends**:
- Two distinct resonant frequencies (`f₁` and `f₂`) with sharp amplitude peaks.
- Minimal energy at frequencies outside `50–200 MHz`.
## Cross-Reference
- **Legend Consistency**:
- Blue circles in (a) correspond to raw data points.
- Black line in (a) represents a fitted or modeled trend.
- Blue shading in (b) highlights dominant Fourier components.
- **Shared Parameters**:
- Both figures reference `T = 2.3 K` (temperature) and `ZF` (zero-field cooling).
## Summary
- **Figure (a)** illustrates time-dependent asymmetry oscillations at cryogenic temperatures, stabilizing after initial transients.
- **Figure (b)** reveals spectral analysis via Fourier transform, identifying two primary resonant frequencies (`f₁` and `f₂`) under identical experimental conditions.