## Line Chart: Model Accuracy vs. Time
### Overview
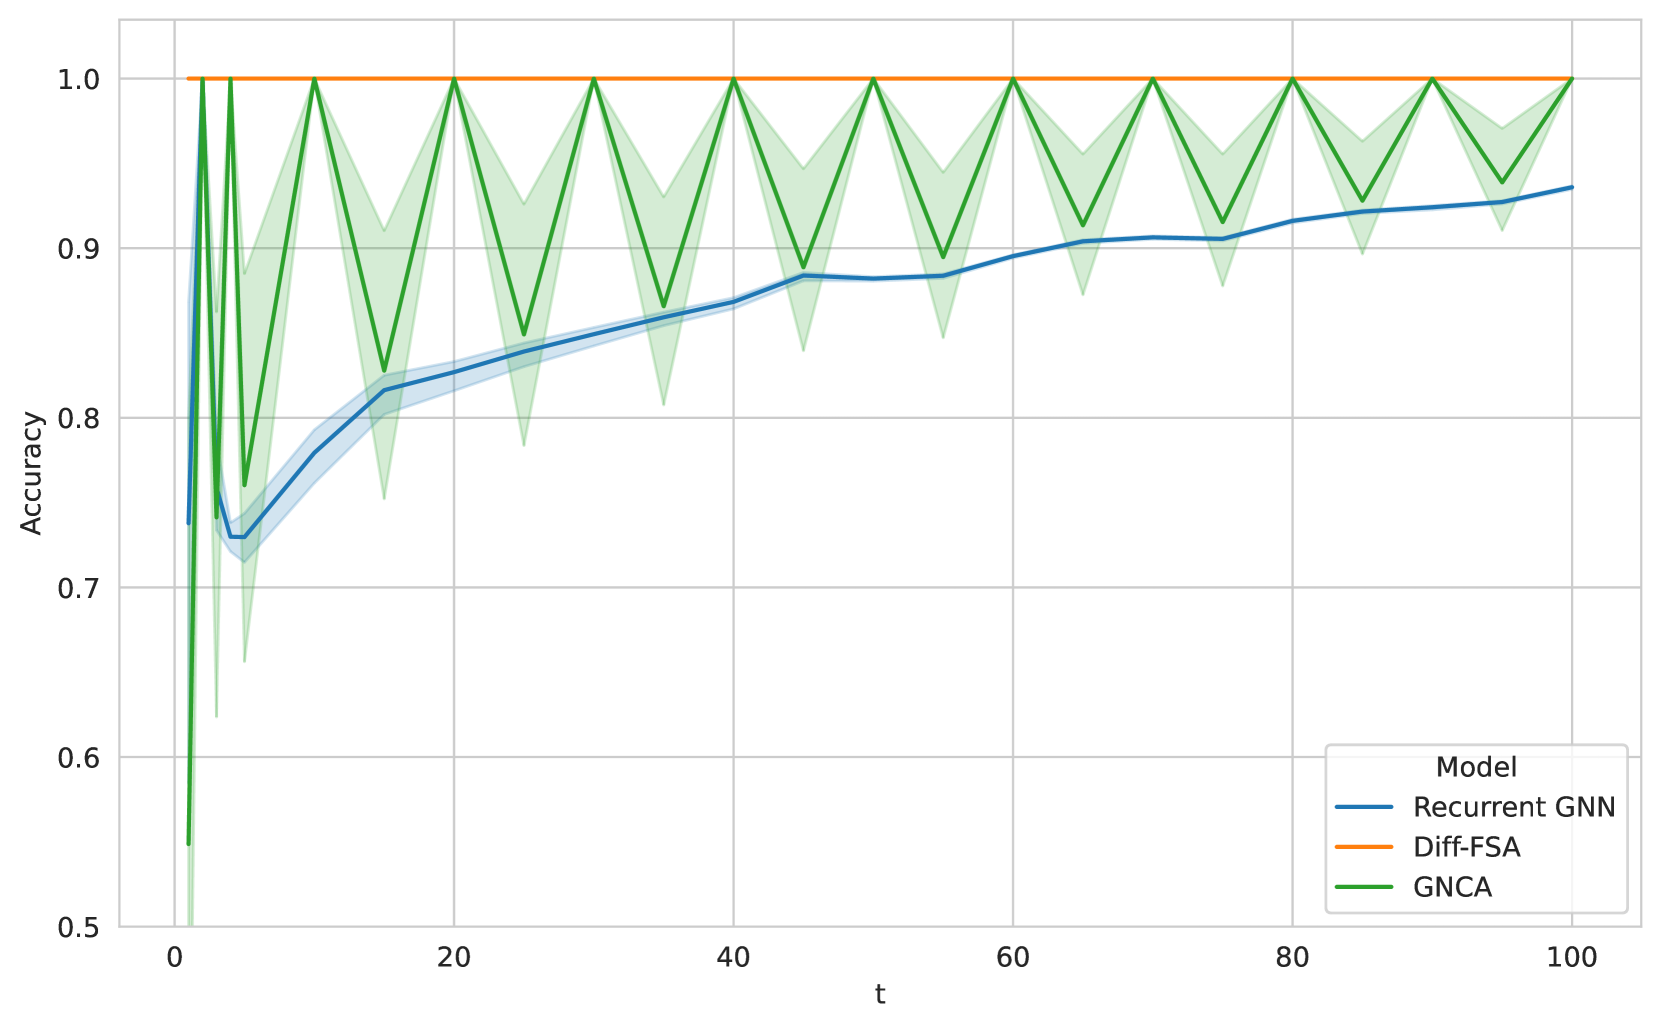
The image is a line chart comparing the accuracy of three different models (Recurrent GNN, Diff-FSA, and GNCA) over time. The x-axis represents time ('t'), ranging from 0 to 100. The y-axis represents accuracy, ranging from 0.5 to 1.0. The chart displays the performance of each model as a function of time, with shaded regions around the GNCA and Recurrent GNN lines indicating variability or confidence intervals.
### Components/Axes
* **X-axis:**
* Label: "t"
* Scale: 0 to 100, with major ticks at 0, 20, 40, 60, 80, and 100.
* **Y-axis:**
* Label: "Accuracy"
* Scale: 0.5 to 1.0, with major ticks at 0.5, 0.6, 0.7, 0.8, 0.9, and 1.0.
* **Legend:** Located in the bottom-right corner.
* Title: "Model"
* Entries:
* Recurrent GNN (Blue line)
* Diff-FSA (Orange line)
* GNCA (Green line)
### Detailed Analysis
* **Recurrent GNN (Blue):**
* Trend: The accuracy starts at approximately 0.73 at t=0, then increases rapidly to about 0.82 by t=10. It continues to increase gradually, reaching approximately 0.88 by t=40, 0.91 by t=60, and 0.93 by t=100. There is a light blue shaded region around the line, indicating the variance in the accuracy.
* Data Points:
* t=0, Accuracy ≈ 0.73
* t=10, Accuracy ≈ 0.82
* t=40, Accuracy ≈ 0.88
* t=60, Accuracy ≈ 0.91
* t=100, Accuracy ≈ 0.93
* **Diff-FSA (Orange):**
* Trend: The accuracy remains constant at 1.0 across the entire time range.
* Data Points:
* Accuracy = 1.0 for all t.
* **GNCA (Green):**
* Trend: The accuracy fluctuates significantly. It starts at approximately 0.5 at t=0, rapidly increases to 1.0, and then oscillates between approximately 0.8 and 1.0. There is a light green shaded region around the line, indicating the variance in the accuracy.
* Data Points (Peaks and Troughs):
* t=0, Accuracy ≈ 0.5
* t=~3, Accuracy ≈ 1.0
* t=~10, Accuracy ≈ 0.8
* t=~15, Accuracy ≈ 1.0
* t=~25, Accuracy ≈ 0.8
* t=~30, Accuracy ≈ 1.0
* t=~40, Accuracy ≈ 0.8
* t=~45, Accuracy ≈ 1.0
* t=~55, Accuracy ≈ 0.8
* t=~60, Accuracy ≈ 1.0
* t=~70, Accuracy ≈ 0.8
* t=~75, Accuracy ≈ 1.0
* t=~85, Accuracy ≈ 0.8
* t=~90, Accuracy ≈ 1.0
* t=~95, Accuracy ≈ 0.9
### Key Observations
* Diff-FSA consistently achieves perfect accuracy (1.0) throughout the entire time range.
* Recurrent GNN shows a gradual improvement in accuracy over time, but never reaches the perfect accuracy of Diff-FSA.
* GNCA exhibits high initial variability and oscillates between 0.8 and 1.0, indicating instability or sensitivity to time.
### Interpretation
The chart demonstrates the performance of three different models over time. Diff-FSA is the most consistent and accurate model, achieving perfect accuracy throughout the entire time range. Recurrent GNN shows a gradual improvement in accuracy, suggesting it learns over time, but it does not reach the same level of accuracy as Diff-FSA. GNCA's oscillating accuracy suggests that it may be sensitive to the specific time step or that it requires further stabilization or tuning. The shaded regions around the Recurrent GNN and GNCA lines indicate the variability or confidence intervals in their accuracy, with GNCA showing a much wider range of variability. The data suggests that Diff-FSA is the superior model for this particular task, as it consistently achieves perfect accuracy.