## Line Chart: Model Accuracy Over Time
### Overview
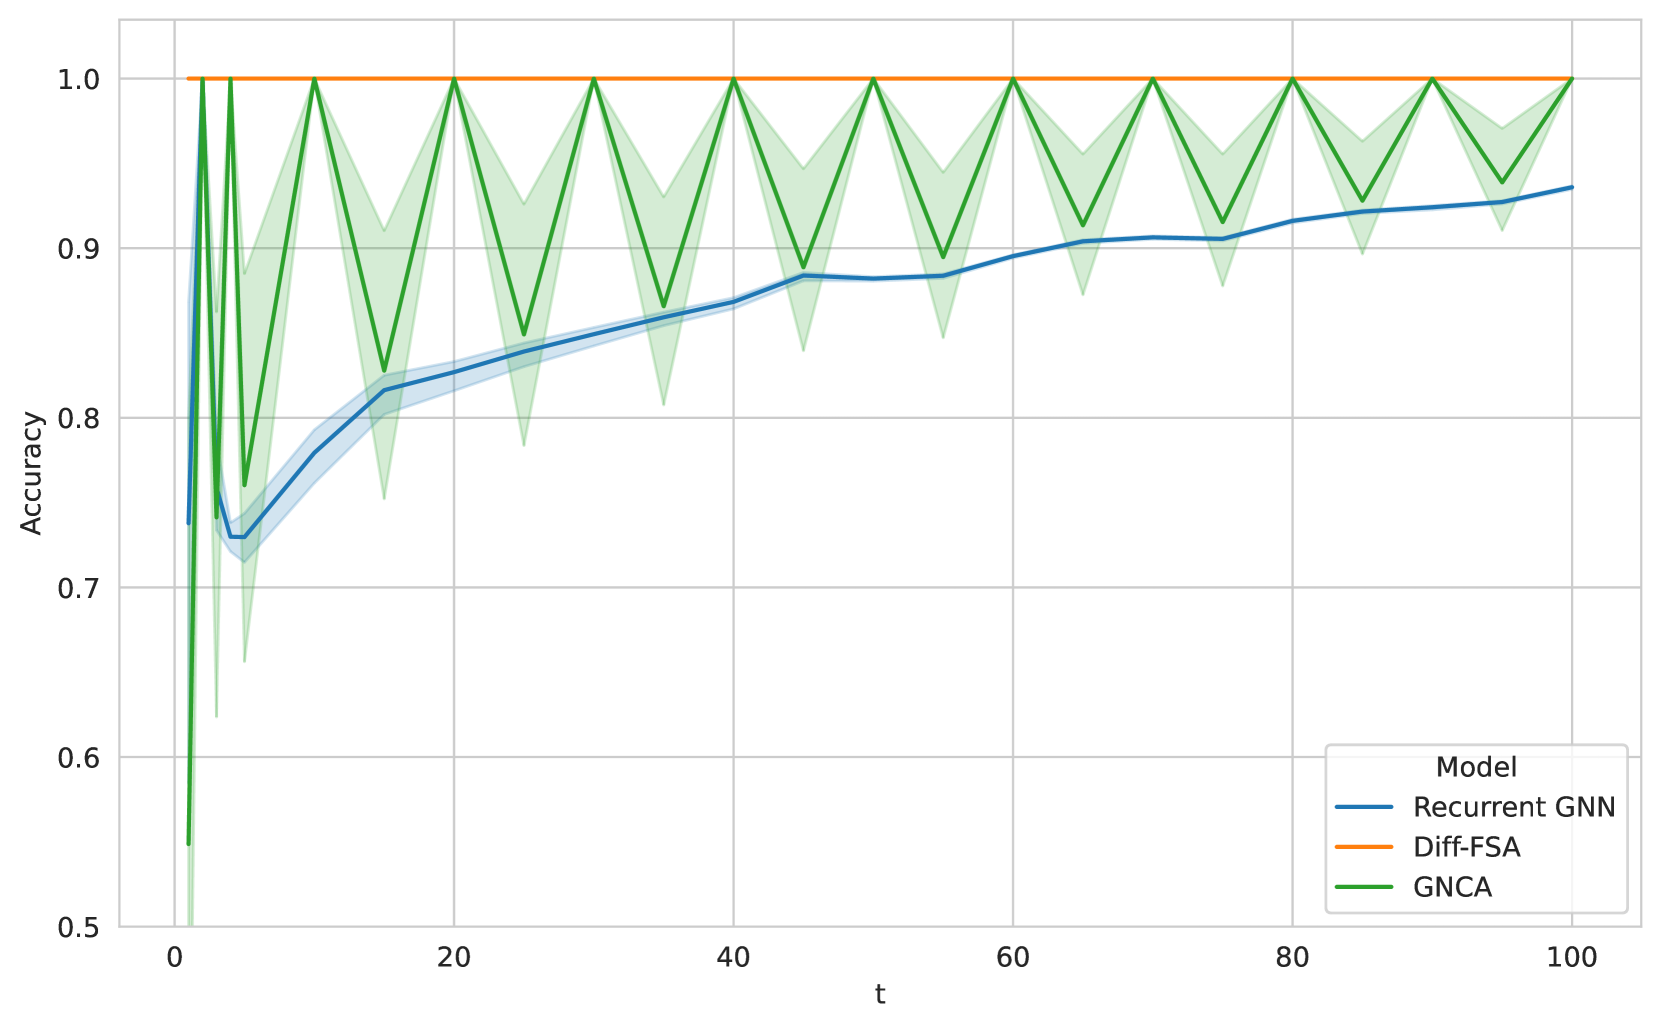
The chart compares the accuracy of three machine learning models (Recurrent GNN, Diff-FSA, GNCA) across a temporal dimension labeled "t" (0 to 100). Accuracy is measured on a scale from 0.5 to 1.0. The Recurrent GNN (blue) shows gradual improvement, Diff-FSA (orange) maintains perfect accuracy, and GNCA (green) exhibits oscillatory behavior with high variability.
### Components/Axes
- **X-axis (t)**: Temporal dimension, labeled "t", ranging from 0 to 100 in increments of 20.
- **Y-axis (Accuracy)**: Accuracy metric, labeled "Accuracy", ranging from 0.5 to 1.0 in increments of 0.1.
- **Legend**: Located in the bottom-right corner, mapping colors to models:
- Blue: Recurrent GNN
- Orange: Diff-FSA
- Green: GNCA
- **Shaded Regions**: Confidence intervals (error margins) around each line, with GNCA showing the widest variability.
### Detailed Analysis
1. **Recurrent GNN (Blue)**:
- Starts at ~0.72 accuracy at t=0.
- Gradually increases to ~0.94 by t=100.
- Confidence interval narrows over time, indicating increasing stability.
2. **Diff-FSA (Orange)**:
- Maintains perfect accuracy (1.0) across all t values.
- No shaded region, suggesting zero variability.
3. **GNCA (Green)**:
- Starts at 1.0 at t=0, then oscillates between ~0.85 and 1.0.
- Peaks at t=0, 10, 20, ..., 100 (every 10 units).
- Confidence interval spans ~0.85–1.0, indicating high variability.
### Key Observations
- **Diff-FSA** achieves flawless performance, outperforming other models consistently.
- **Recurrent GNN** demonstrates steady improvement but never reaches perfect accuracy.
- **GNCA** exhibits erratic behavior, with sharp drops in accuracy despite periodic peaks.
- Confidence intervals reveal GNCA's predictions are least reliable, while Diff-FSA's are perfectly consistent.
### Interpretation
The data suggests **Diff-FSA** is the most robust model for this task, maintaining perfect accuracy without deviation. **Recurrent GNN** shows promise as a learning model, improving over time but remaining suboptimal. **GNCA**'s oscillatory pattern and wide confidence intervals indicate instability, possibly due to overfitting or sensitivity to input variations. The absence of error margins for Diff-FSA implies deterministic performance, making it the most trustworthy choice in this context.