## Radar Chart: Prior Trade-off @ 3.0 kbps
### Overview
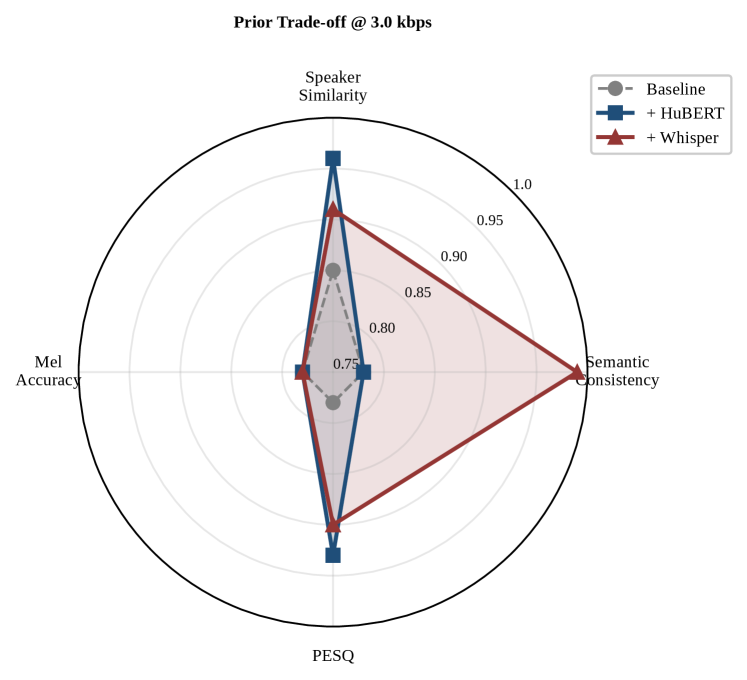
The image is a radar chart comparing three data series ("Baseline," "+ HuBERT," and "+ Whisper") across four metrics: Semantic Consistency, Speaker Similarity, PESQ, and Mel Accuracy. The chart uses a circular layout with axes radiating from a central point, and data points are plotted as markers connected by lines. The legend is positioned in the top-right corner, and the chart title is centered at the top.
---
### Components/Axes
- **Axes (Metrics)**:
- **Semantic Consistency** (top-right, 0.75–1.0 scale)
- **Speaker Similarity** (top-left, 0.75–1.0 scale)
- **PESQ** (bottom-left, 0.75–1.0 scale)
- **Mel Accuracy** (bottom-right, 0.75–1.0 scale)
- **Legend**:
- **Baseline**: Gray dashed line with circle markers
- **+ HuBERT**: Blue solid line with square markers
- **+ Whisper**: Red solid line with star markers
- **Axes Markers**: Concentric circles with labels at 0.75, 0.80, 0.85, 0.90, 0.95, and 1.0.
---
### Detailed Analysis
1. **Baseline (Gray)**:
- **Semantic Consistency**: ~0.85
- **Speaker Similarity**: ~0.80
- **PESQ**: ~0.75
- **Mel Accuracy**: ~0.75
- **Trend**: Lowest values across all metrics, forming a compact polygon near the center.
2. **+ HuBERT (Blue)**:
- **Semantic Consistency**: ~0.95
- **Speaker Similarity**: ~0.95
- **PESQ**: ~0.90
- **Mel Accuracy**: ~0.90
- **Trend**: High values in Semantic Consistency and Speaker Similarity, with moderate improvements in PESQ and Mel Accuracy compared to Baseline.
3. **+ Whisper (Red)**:
- **Semantic Consistency**: ~0.90
- **Speaker Similarity**: ~0.95
- **PESQ**: ~0.90
- **Mel Accuracy**: ~0.90
- **Trend**: Peaks at Speaker Similarity (~0.95), with slightly lower but still strong values in other metrics.
---
### Key Observations
- **Whisper** achieves the highest value in **Speaker Similarity** (~0.95) but lags slightly behind HuBERT in Semantic Consistency (~0.90 vs. 0.95).
- **HuBERT** dominates in **Semantic Consistency** and **Speaker Similarity**, with balanced performance in PESQ and Mel Accuracy.
- **Baseline** underperforms across all metrics, with the lowest values (~0.75–0.85).
- **+ HuBERT** and **+ Whisper** show similar trade-offs: strong gains in Semantic Consistency/Speaker Similarity at the cost of slightly lower PESQ/Mel Accuracy compared to Baseline.
---
### Interpretation
The chart illustrates a trade-off between audio quality metrics (PESQ, Mel Accuracy) and perceptual metrics (Semantic Consistency, Speaker Similarity).
- **HuBERT** prioritizes perceptual quality, excelling in Semantic Consistency and Speaker Similarity but sacrificing some objective quality (PESQ/Mel Accuracy).
- **Whisper** balances perceptual and objective quality, with the highest Speaker Similarity but slightly lower Semantic Consistency than HuBERT.
- **Baseline** represents the lowest performance, serving as a reference for degradation.
The data suggests that HuBERT and Whisper improve perceptual aspects of audio processing at the expense of objective quality metrics, highlighting a common trade-off in audio enhancement systems. The proximity of HuBERT and Whisper in PESQ/Mel Accuracy indicates that perceptual gains may not always correlate with objective quality improvements.