\n
## System Resource Monitor: Performance Overview
### Overview
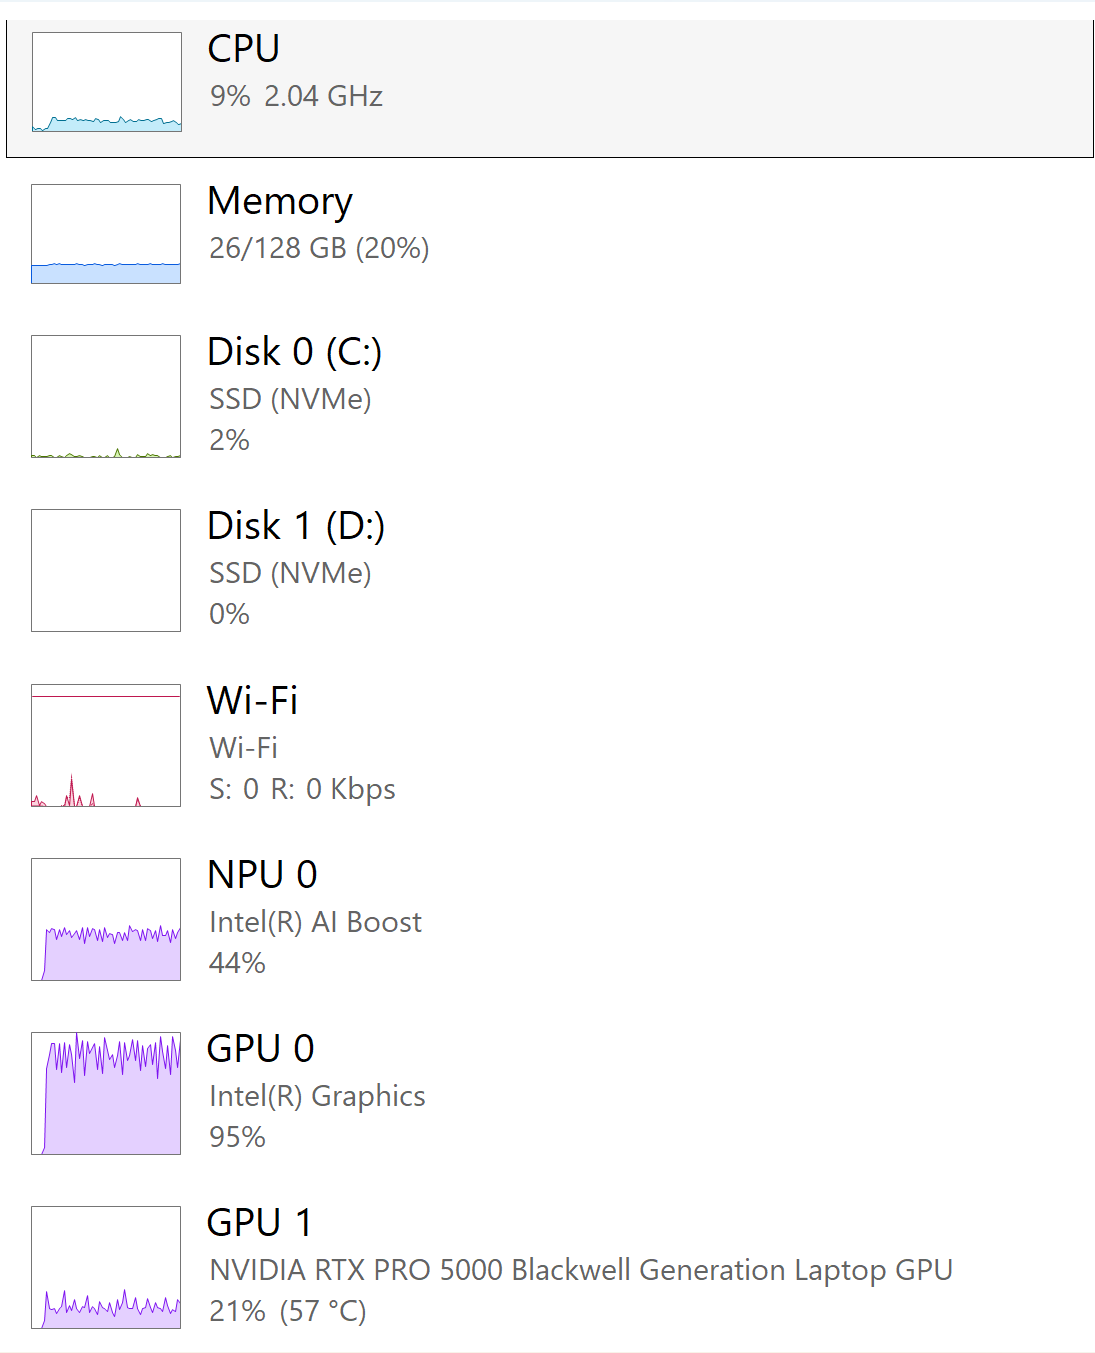
The image presents a snapshot of system resource utilization, displaying the current load on various hardware components. It's a vertical list of resource monitors, each showing a graphical representation of activity and associated numerical data. The components monitored are CPU, Memory, Disk 0 (C:), Disk 1 (D:), Wi-Fi, NPU 0, GPU 0, and GPU 1.
### Components/Axes
The image does not contain traditional axes. Instead, each component has a label indicating the resource being monitored (e.g., "CPU", "Memory"). Each component also displays a graphical representation of activity (a bar or line graph) and associated numerical data. The numerical data includes percentage usage, clock speed (for CPU), capacity/usage (for Memory and Disks), and speed (for Wi-Fi). GPU 0 displays percentage usage, and GPU 1 displays percentage usage and temperature.
### Detailed Analysis or Content Details
* **CPU:** 9% usage, 2.04 GHz clock speed. The graphical representation is a light blue bar.
* **Memory:** 26/128 GB used, representing 20% utilization. The graphical representation is a light blue bar.
* **Disk 0 (C:):** SSD (NVMe), 2% usage. The graphical representation is a light blue bar.
* **Disk 1 (D:):** SSD (NVMe), 0% usage. The graphical representation is a light blue bar.
* **Wi-Fi:** Wi-Fi, S: 0 R: 0 Kbps. The graphical representation is a pink line graph showing minimal activity.
* **NPU 0:** Intel(R) AI Boost, 44% usage. The graphical representation is a purple line graph.
* **GPU 0:** Intel(R) Graphics, 95% usage. The graphical representation is a purple line graph.
* **GPU 1:** NVIDIA RTX 5000 PRO Blackwell Generation Laptop GPU, 21% usage, 57°C temperature. The graphical representation is a teal line graph.
### Key Observations
* GPU 0 is experiencing very high utilization (95%).
* Disk 1 (D:) has no reported activity (0% usage).
* Wi-Fi has no reported send or receive activity (0 Kbps).
* CPU usage is relatively low (9%).
* Memory usage is moderate (20%).
* GPU 1 is operating at a moderate temperature (57°C).
### Interpretation
The data suggests that the system is currently under moderate load, with the primary bottleneck being GPU 0. The high GPU 0 utilization could indicate a demanding graphics application or process is running. The low CPU usage suggests that the CPU is not a limiting factor in the current workload. The minimal disk activity on Disk 1 (D:) and no Wi-Fi activity suggest these resources are not currently being utilized. The NPU is at 44% utilization, indicating some AI processing is occurring. The temperature of GPU 1 is within a normal operating range. Overall, the system appears to be functioning normally, but the high GPU 0 utilization warrants further investigation if performance issues are observed. The system is likely performing a task that is heavily reliant on integrated graphics (GPU 0), while the dedicated GPU (GPU 1) is handling a smaller portion of the workload.