## System Performance Monitor: Real-Time Hardware Utilization
### Overview
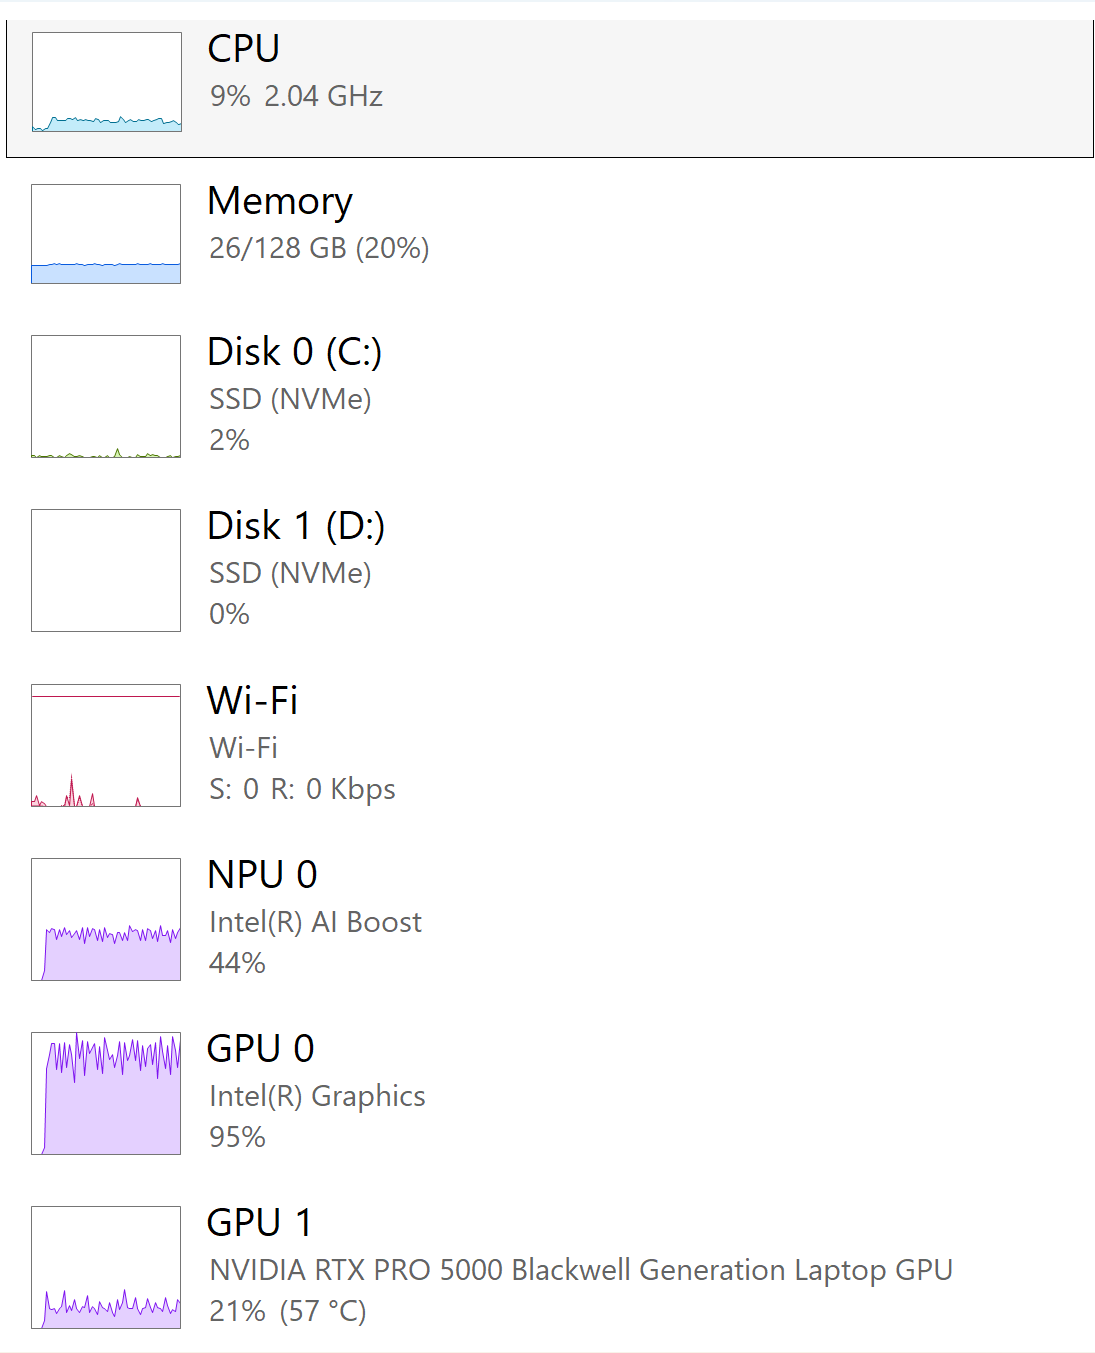
The image displays a real-time system performance monitoring interface, likely from a Windows Task Manager or similar utility. It presents a vertical list of eight hardware components, each with a small historical performance graph, a component name, a sub-label (often the device model), and current utilization metrics. The interface uses a clean, light-themed design with a white background and gray text.
### Components/Axes
The interface is structured as a vertical list of eight distinct component panels. Each panel contains:
1. **A small rectangular graph** on the left, showing a historical trend line (approximately the last 60 seconds).
2. **Component Title** (e.g., "CPU", "Memory") in bold, black text.
3. **Sub-label/Device Name** in gray text below the title.
4. **Current Utilization Data** in gray text, typically a percentage and sometimes additional metrics like frequency, capacity, or temperature.
**List of Components (from top to bottom):**
1. **CPU**
2. **Memory**
3. **Disk 0 (C:)**
4. **Disk 1 (D:)**
5. **Wi-Fi**
6. **NPU 0**
7. **GPU 0**
8. **GPU 1**
### Detailed Analysis
**Component-by-Component Breakdown:**
1. **CPU**
* **Graph:** A cyan line showing a relatively flat trend with minor, low-amplitude fluctuations. The line is positioned in the lower portion of the graph area.
* **Sub-label:** None visible.
* **Data:** `9% 2.04 GHz`
* **Spatial Grounding:** Topmost panel. Graph line color: cyan.
2. **Memory**
* **Graph:** A solid blue line forming a flat, horizontal line near the bottom of the graph area, indicating constant usage.
* **Sub-label:** None visible.
* **Data:** `26/128 GB (20%)`
* **Spatial Grounding:** Second panel from top. Graph line color: blue.
3. **Disk 0 (C:)**
* **Graph:** A green line showing very low, sporadic activity with a few small spikes near the baseline.
* **Sub-label:** `SSD (NVMe)`
* **Data:** `2%`
* **Spatial Grounding:** Third panel. Graph line color: green.
4. **Disk 1 (D:)**
* **Graph:** A flat line at the very bottom of the graph area, indicating zero or near-zero activity.
* **Sub-label:** `SSD (NVMe)`
* **Data:** `0%`
* **Spatial Grounding:** Fourth panel. Graph line color: appears as a very faint or absent line, consistent with 0% usage.
5. **Wi-Fi**
* **Graph:** A magenta/pink line showing a few distinct, sharp spikes of activity against a flat baseline.
* **Sub-label:** `Wi-Fi`
* **Data:** `S: 0 R: 0 Kbps` (Send: 0 Kbps, Receive: 0 Kbps)
* **Spatial Grounding:** Fifth panel. Graph line color: magenta/pink.
6. **NPU 0**
* **Graph:** A purple line showing a highly active, jagged pattern with frequent, high-amplitude fluctuations, filling much of the graph's vertical space.
* **Sub-label:** `Intel(R) AI Boost`
* **Data:** `44%`
* **Spatial Grounding:** Sixth panel. Graph line color: purple.
7. **GPU 0**
* **Graph:** A purple line (similar hue to NPU 0) showing extremely high, sustained activity. The line is dense and jagged, consistently near the top of the graph area.
* **Sub-label:** `Intel(R) Graphics`
* **Data:** `95%`
* **Spatial Grounding:** Seventh panel. Graph line color: purple.
8. **GPU 1**
* **Graph:** A purple line showing moderate, consistent activity with regular fluctuations, positioned in the middle-to-upper portion of the graph.
* **Sub-label:** `NVIDIA RTX PRO 5000 Blackwell Generation Laptop GPU`
* **Data:** `21% (57 °C)`
* **Spatial Grounding:** Bottom panel. Graph line color: purple.
### Key Observations
* **High GPU/NPU Load:** The system is under significant computational load, primarily on the graphics and AI acceleration hardware. GPU 0 (Intel integrated graphics) is at near-maximum utilization (95%), and the dedicated NPU is at 44%.
* **Low CPU and Memory Pressure:** The CPU is lightly loaded (9%), and only 20% of the 128 GB system memory is in use, indicating the workload is highly parallelizable or offloaded to specialized processors.
* **Minimal Storage and Network Activity:** Both SSDs and the Wi-Fi connection show negligible activity, suggesting the current task is compute-bound, not I/O-bound.
* **Dual GPU Configuration:** The system has both integrated Intel graphics (GPU 0) and a high-end discrete NVIDIA GPU (GPU 1). Interestingly, the integrated GPU is showing much higher utilization than the discrete one in this snapshot.
* **Thermal Data:** Only GPU 1 reports a temperature (57 °C), which is within a normal operating range under moderate load.
### Interpretation
This performance snapshot strongly suggests the system is actively running a **graphics-intensive or AI/ML inference workload**. The extremely high utilization of the Intel integrated GPU (95%) is the most notable anomaly. This could indicate several scenarios:
1. The specific application or task is optimized for or defaulting to the integrated GPU.
2. The discrete NVIDIA GPU (GPU 1) may be handling a different, less demanding part of the workload, or its usage is not fully captured by this specific monitoring view.
3. The "Intel(R) AI Boost" NPU at 44% confirms that AI-specific hardware is engaged, pointing towards tasks like real-time AI image processing, video effects, or running a local AI model.
The combination of high GPU/NPU load with low CPU, memory, disk, and network usage paints a picture of a specialized computation task that leverages parallel processing on silicon designed for graphics and matrix operations, rather than general-purpose computing. The system appears well-equipped (128 GB RAM, dual GPUs, NPU) for such workloads.