## System Monitor Dashboard: Hardware Resource Utilization
### Overview
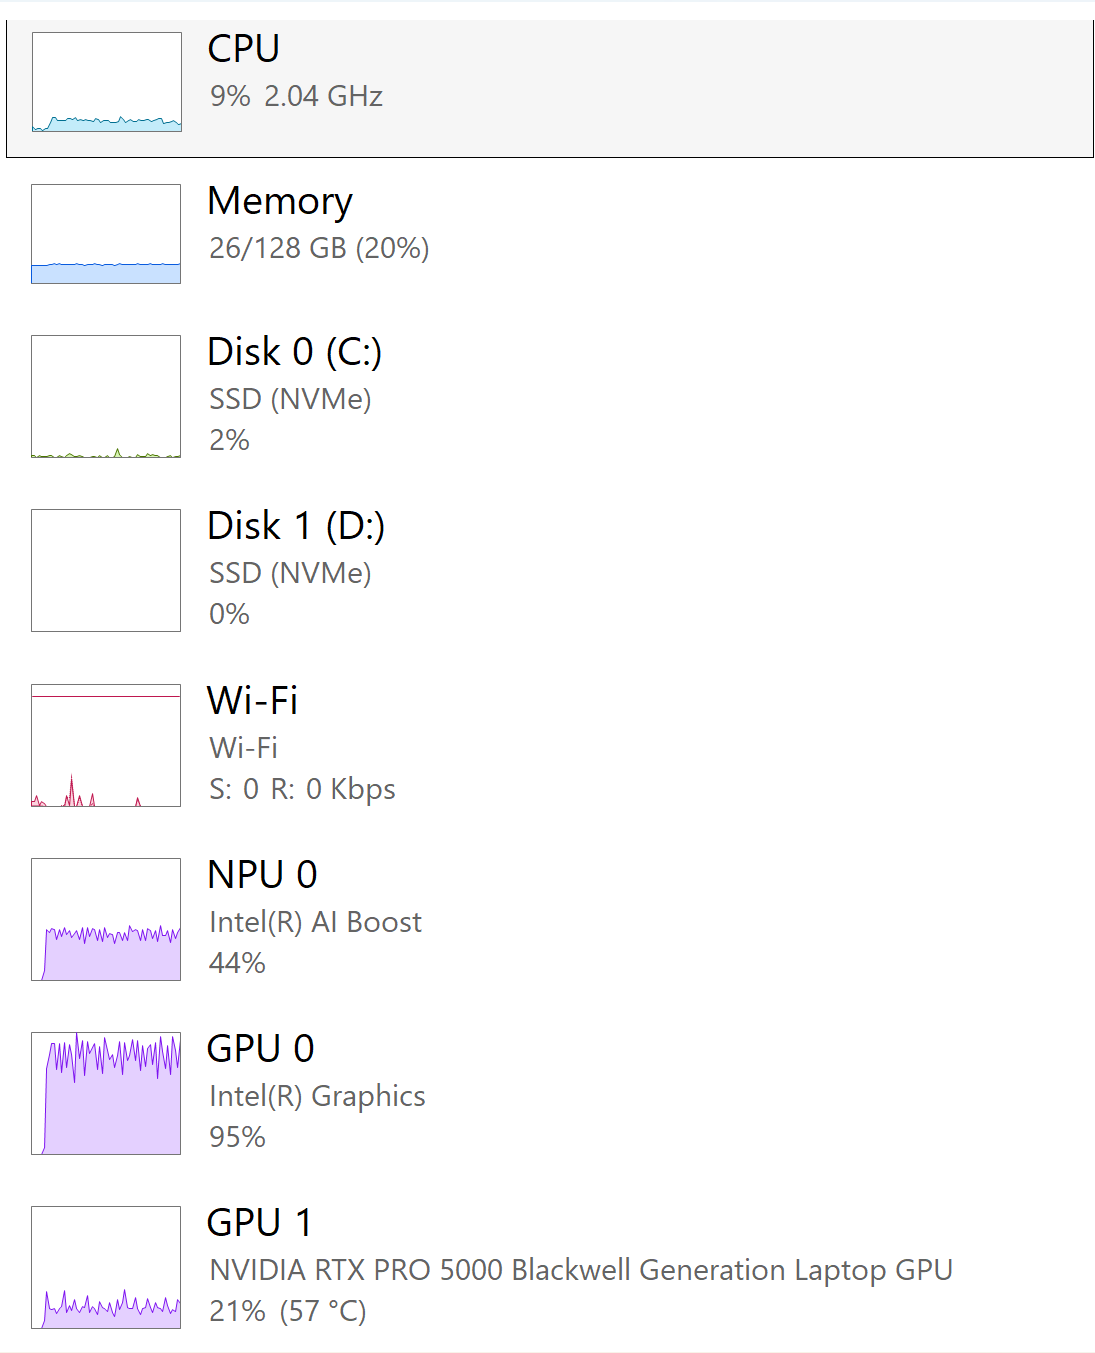
The image displays a system performance monitor interface tracking real-time hardware resource usage. It includes eight components with graphical representations (line charts) and numerical metrics. Components are arranged vertically with distinct color-coded visualizations.
### Components/Axes
1. **CPU** (Light Blue)
- Label: "CPU"
- Metric: 9% usage, 2.04 GHz clock speed
- Graph: Horizontal line chart with minimal blue waveform
2. **Memory** (Light Blue)
- Label: "Memory"
- Metric: 26/128 GB (20% usage)
- Graph: Small blue bar at 20% level
3. **Disk 0 (C:)** (Green)
- Label: "Disk 0 (C:)"
- Metric: SSD (NVMe), 2% usage
- Graph: Minimal green waveform near baseline
4. **Disk 1 (D:)** (White)
- Label: "Disk 1 (D:)"
- Metric: SSD (NVMe), 0% usage
- Graph: Empty white space
5. **Wi-Fi** (Red)
- Label: "Wi-Fi"
- Metric: S: 0 R: 0 Kbps
- Graph: Red spikes with low baseline activity
6. **NPU 0** (Purple)
- Label: "NPU 0"
- Metric: Intel(R) AI Boost, 44% usage
- Graph: Moderate purple waveform
7. **GPU 0** (Dark Purple)
- Label: "GPU 0"
- Metric: Intel(R) Graphics, 95% usage
- Graph: Near-maximum dark purple waveform
8. **GPU 1** (Light Purple)
- Label: "GPU 1"
- Metric: NVIDIA RTX PRO 5000 Blackwell, 21% usage, 57°C temperature
- Graph: Low light purple waveform with temperature annotation
### Detailed Analysis
- **CPU**: Flat line with minor fluctuations, indicating low processing load.
- **Memory**: Consistent 20% usage with no significant spikes.
- **Disk 0**: Near-idle with occasional minor activity.
- **Disk 1**: Completely idle (0% usage).
- **Wi-Fi**: Sporadic red spikes but overall minimal network activity.
- **NPU 0**: Moderate purple waveform suggests active AI processing.
- **GPU 0**: Near-maximum dark purple line indicates heavy graphical workload.
- **GPU 1**: Light purple waveform at 21% usage with thermal monitoring (57°C).
### Key Observations
1. **GPU 0 Dominance**: 95% utilization suggests intensive GPU-dependent tasks (e.g., gaming, rendering).
2. **NPU Activity**: 44% usage indicates active AI/ML processing.
3. **Thermal Monitoring**: GPU 1 temperature (57°C) is within safe operating range.
4. **Disk 1 Inactivity**: 0% usage may indicate unmounted drive or lack of storage activity.
5. **Wi-Fi Idleness**: 0 Kbps suggests no active network transfers.
### Interpretation
The system appears optimized for GPU-intensive workloads, with NPU support for AI tasks. The CPU and memory usage remain low, suggesting efficient resource allocation. Disk 1's inactivity warrants investigation if intended for use. The thermal profile of GPU 1 (57°C) is normal for sustained operation. The absence of network activity (Wi-Fi) may indicate a wired connection or offline status. The GPU 0's near-maximum utilization contrasts with GPU 1's moderate load, possibly reflecting workload distribution between integrated and dedicated graphics.