## Chart: Mutual Information Surprise
### Overview
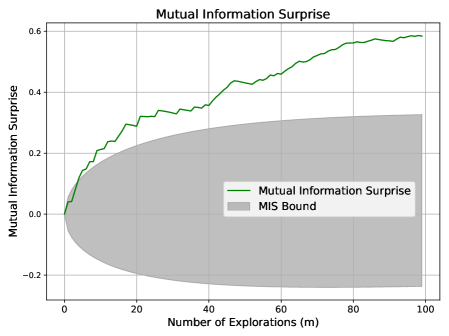
The image is a line chart that plots "Mutual Information Surprise" against "Number of Explorations (m)". It shows how the mutual information surprise changes as the number of explorations increases. A shaded area represents the "MIS Bound".
### Components/Axes
* **Title:** Mutual Information Surprise
* **X-axis:** Number of Explorations (m), with ticks at 0, 20, 40, 60, 80, and 100.
* **Y-axis:** Mutual Information Surprise, with ticks at -0.2, 0.0, 0.2, 0.4, and 0.6.
* **Legend:** Located in the center-right of the chart.
* Green line: Mutual Information Surprise
* Gray area: MIS Bound
### Detailed Analysis
* **Mutual Information Surprise (Green Line):**
* Trend: The line starts at approximately 0.0 and increases rapidly initially. The rate of increase slows down as the number of explorations increases, eventually plateauing around 0.57.
* Data Points:
* At 0 explorations, the value is approximately 0.0.
* At 20 explorations, the value is approximately 0.33.
* At 40 explorations, the value is approximately 0.36.
* At 60 explorations, the value is approximately 0.44.
* At 80 explorations, the value is approximately 0.54.
* At 100 explorations, the value is approximately 0.57.
* **MIS Bound (Gray Area):**
* The shaded gray area represents a bound. It starts at approximately 0.0 at 0 explorations, expands both positively and negatively, and then plateaus.
* The upper bound plateaus at approximately 0.32.
* The lower bound plateaus at approximately -0.22.
### Key Observations
* The Mutual Information Surprise increases rapidly at first and then plateaus.
* The MIS Bound provides a range within which the Mutual Information Surprise is expected to fall.
* The Mutual Information Surprise line remains above the lower bound of the MIS Bound throughout the range of explorations.
### Interpretation
The chart suggests that as the number of explorations increases, the mutual information surprise initially increases rapidly, indicating that the agent is learning quickly. However, as the number of explorations continues to increase, the rate of learning slows down, and the mutual information surprise plateaus. The MIS Bound provides a measure of the uncertainty or variability in the mutual information surprise. The fact that the Mutual Information Surprise line remains within the MIS Bound suggests that the agent's learning is consistent with the expected range of variability. The plateauing of the Mutual Information Surprise suggests that the agent may have reached a point of diminishing returns, where further explorations do not lead to significant improvements in learning.