\n
## Line Chart: Mutual Information Surprise
### Overview
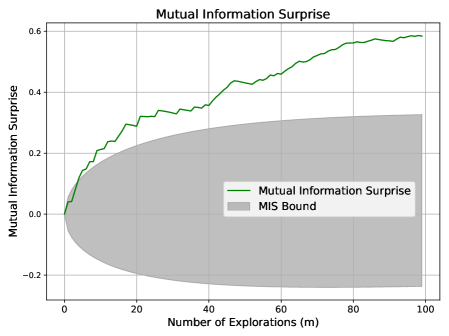
The image presents a line chart illustrating the relationship between the number of explorations (m) and the mutual information surprise. A shaded region represents the MIS (Mutual Information Surprise) bound. The chart aims to demonstrate how the mutual information surprise changes as the number of explorations increases, and how it relates to a theoretical bound.
### Components/Axes
* **X-axis:** Number of Explorations (m), ranging from 0 to 100.
* **Y-axis:** Mutual Information Surprise, ranging from 0.0 to 0.6.
* **Line 1:** "Mutual Information Surprise" - a green line representing the observed mutual information surprise.
* **Area:** "MIS Bound" - a gray shaded area representing the theoretical bound for mutual information surprise.
* **Legend:** Located in the top-right corner, identifying the line and shaded area.
### Detailed Analysis
The green line representing "Mutual Information Surprise" starts at approximately 0.05 at m=0. The line generally slopes upward, indicating an increase in mutual information surprise as the number of explorations increases.
Here's a breakdown of approximate data points:
* m = 0: Mutual Information Surprise ≈ 0.05
* m = 10: Mutual Information Surprise ≈ 0.18
* m = 20: Mutual Information Surprise ≈ 0.25
* m = 30: Mutual Information Surprise ≈ 0.33
* m = 40: Mutual Information Surprise ≈ 0.40
* m = 50: Mutual Information Surprise ≈ 0.45
* m = 60: Mutual Information Surprise ≈ 0.50
* m = 70: Mutual Information Surprise ≈ 0.54
* m = 80: Mutual Information Surprise ≈ 0.57
* m = 90: Mutual Information Surprise ≈ 0.59
* m = 100: Mutual Information Surprise ≈ 0.60
The gray shaded area ("MIS Bound") starts at approximately -0.1 at m=0 and expands upwards as m increases, reaching a maximum height of approximately 0.35 at m=100. The line representing "Mutual Information Surprise" remains consistently *above* the "MIS Bound" throughout the entire range of explorations.
### Key Observations
* The mutual information surprise increases with the number of explorations, but the rate of increase diminishes as the number of explorations grows larger.
* The observed mutual information surprise consistently exceeds the theoretical MIS bound.
* The line exhibits some fluctuations, suggesting that the increase in mutual information surprise is not perfectly smooth.
### Interpretation
The chart suggests that increasing the number of explorations leads to a greater understanding or revelation of information (as measured by mutual information surprise). The fact that the observed surprise consistently exceeds the theoretical bound indicates that the exploration process is yielding more information than expected based on the MIS model. This could imply that the model is conservative or that there are factors not accounted for in the MIS calculation that contribute to the observed surprise. The diminishing rate of increase suggests that there may be a point of diminishing returns, where further explorations yield progressively smaller increases in mutual information surprise. The fluctuations in the line could be due to the inherent randomness or complexity of the exploration process. This chart is likely used to evaluate the effectiveness of an exploration strategy or algorithm, and to understand the trade-off between exploration effort and information gain.