## [Line Chart with Shaded Region]: Mutual Information Surprise
### Overview
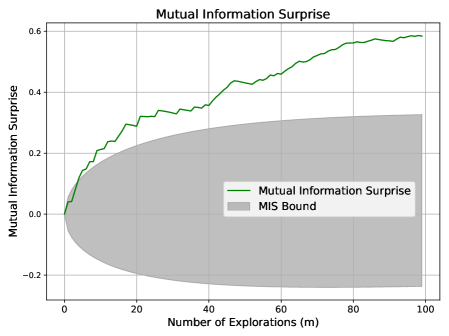
This image is a line chart titled "Mutual Information Surprise" that plots a metric called "Mutual Information Surprise" against the "Number of Explorations (m)". The chart includes a primary data series represented by a green line and a secondary shaded region representing a bound. The overall trend shows the surprise metric increasing with the number of explorations.
### Components/Axes
* **Chart Title:** "Mutual Information Surprise" (Top-center)
* **X-Axis:**
* **Label:** "Number of Explorations (m)" (Bottom-center)
* **Scale:** Linear scale from 0 to 100.
* **Major Tick Marks:** 0, 20, 40, 60, 80, 100.
* **Y-Axis:**
* **Label:** "Mutual Information Surprise" (Left-center, rotated vertically)
* **Scale:** Linear scale from -0.2 to 0.6.
* **Major Tick Marks:** -0.2, 0.0, 0.2, 0.4, 0.6.
* **Legend:** Positioned in the bottom-right quadrant of the chart area.
* **Green Line:** Labeled "Mutual Information Surprise".
* **Gray Shaded Area:** Labeled "MIS Bound".
* **Grid:** A light gray grid is present, aligning with the major tick marks on both axes.
### Detailed Analysis
**1. Primary Data Series (Green Line - "Mutual Information Surprise"):**
* **Trend Verification:** The line exhibits a clear, consistent upward trend from left to right. It starts near the origin and rises with a slightly decreasing slope as the number of explorations increases.
* **Data Point Extraction (Approximate):**
* At m=0, y ≈ 0.0
* At m=10, y ≈ 0.15
* At m=20, y ≈ 0.30
* At m=40, y ≈ 0.35
* At m=60, y ≈ 0.45
* At m=80, y ≈ 0.55
* At m=100, y ≈ 0.58
**2. Secondary Data Series (Gray Shaded Region - "MIS Bound"):**
* **Trend Verification:** The shaded region represents a range or confidence interval. It starts as a point at (0,0), widens significantly as 'm' increases, reaching its maximum vertical span around m=40-60, and then appears to narrow slightly towards m=100.
* **Boundary Extraction (Approximate):**
* **Upper Bound:** Starts at 0, rises to ~0.25 at m=20, ~0.30 at m=60, and ~0.33 at m=100.
* **Lower Bound:** Starts at 0, drops to ~-0.15 at m=20, ~-0.20 at m=60, and ~-0.18 at m=100.
* The green "Mutual Information Surprise" line remains above the upper boundary of the "MIS Bound" for all m > 0.
### Key Observations
1. **Dominant Trend:** The "Mutual Information Surprise" metric shows a strong, monotonic increase as the number of explorations grows, suggesting a cumulative or learning effect.
2. **Relationship to Bound:** The measured surprise (green line) consistently exceeds the upper limit of the "MIS Bound" (gray area) after the initial point. This indicates the bound is a conservative estimate or a theoretical lower limit that the actual metric surpasses.
3. **Shape of Growth:** The rate of increase in surprise is highest for the first ~20 explorations and gradually slows, though it never plateaus completely within the observed range (m=0 to 100).
4. **Bound Behavior:** The "MIS Bound" expands and then stabilizes, suggesting the theoretical uncertainty or range of possible values grows with initial exploration before settling.
### Interpretation
This chart likely visualizes a concept from information theory, reinforcement learning, or active learning. "Mutual Information Surprise" probably quantifies how much new, unexpected information an agent gains from each exploration step.
* **What the data suggests:** The upward trend demonstrates that with each additional exploration (m), the agent continues to discover information that is surprising relative to its prior knowledge. The decreasing slope suggests diminishing returns—the most surprising information is found early on, but novel information is still being acquired even after 100 steps.
* **How elements relate:** The "MIS Bound" serves as a benchmark. The fact that the actual surprise metric lies above this bound implies the agent's exploration strategy is effective at finding information that is more surprising than a theoretical minimum or baseline expectation. The widening of the bound may reflect increasing variance or a larger space of possible outcomes as exploration proceeds.
* **Notable implication:** The chart provides empirical evidence that the exploration process is successfully uncovering novel information, as measured by mutual information surprise, and that this process outperforms a defined theoretical bound. This could be used to validate an exploration algorithm or to illustrate the information gain properties of a system.