## Line Graph: Mutual Information Surprise
### Overview
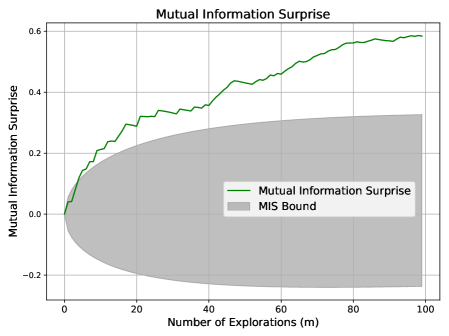
The image depicts a line graph titled "Mutual Information Surprise," illustrating the relationship between the number of explorations (m) and mutual information surprise. A green line represents the "Mutual Information Surprise" metric, while a gray shaded semicircular area represents the "MIS Bound." The graph spans 0 to 100 explorations on the x-axis and -0.2 to 0.6 on the y-axis.
### Components/Axes
- **Title**: "Mutual Information Surprise" (centered at the top).
- **X-axis**: "Number of Explorations (m)" with ticks at 0, 20, 40, 60, 80, 100.
- **Y-axis**: "Mutual Information Surprise" with ticks at -0.2, 0.0, 0.2, 0.4, 0.6.
- **Legend**: Located in the bottom-right corner, with:
- Green line: "Mutual Information Surprise"
- Gray shaded area: "MIS Bound"
### Detailed Analysis
1. **Mutual Information Surprise (Green Line)**:
- Starts at (0, 0.0) and increases monotonically.
- Reaches approximately 0.6 by x=100.
- Key data points:
- x=0: 0.0
- x=20: ~0.25
- x=40: ~0.35
- x=60: ~0.45
- x=80: ~0.55
- x=100: ~0.6
2. **MIS Bound (Gray Shaded Area)**:
- A semicircular region spanning x=0 to x=100.
- Covers y-values from -0.2 to 0.6.
- Peaks at y=0.6 at x=50, then tapers to y=0.0 at x=0 and x=100.
### Key Observations
- The green line consistently lies **above** the gray shaded area, indicating that the observed mutual information surprise exceeds the theoretical MIS Bound across all exploration counts.
- The green line’s growth rate accelerates slightly after x=40, suggesting diminishing returns in information gain as explorations increase.
- The MIS Bound’s semicircular shape implies a theoretical upper limit that is not strictly linear but constrained by exploration count.
### Interpretation
The data demonstrates that the system’s mutual information surprise grows with exploration but remains bounded by the MIS framework. The green line’s trajectory suggests that while exploration improves information gain, the rate of improvement slows as the system approaches the MIS Bound’s upper limit. The shaded area’s semicircular form may represent a probabilistic or geometric constraint on mutual information, highlighting a trade-off between exploration depth and information efficiency. Notably, the green line’s final value (0.6) aligns with the MIS Bound’s peak, implying that maximum theoretical surprise is achievable but requires near-complete exploration (x=100). This could indicate that the MIS Bound is asymptotically tight for this system.