## Pie Charts: Distribution of Data Across Categories and Temperatures
### Overview
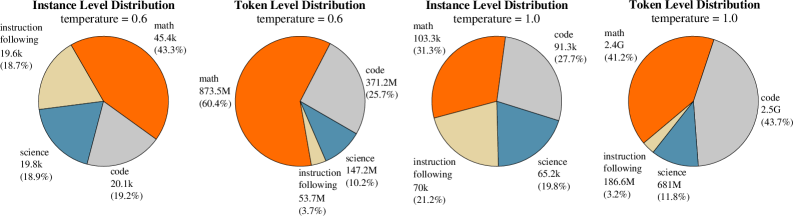
The image presents four pie charts, arranged in a 2x2 grid. Each chart visualizes the distribution of data across four categories: "instruction following", "math", "science", and "code". The charts are differentiated by "temperature" settings of 0.6 and 1.0, and whether the distribution is at the "Instance Level" or "Token Level". Each slice of the pie chart is labeled with the category name and a numerical value representing its proportion.
### Components/Axes
Each chart has the following components:
* **Title:** Indicates the distribution type ("Instance Level Distribution" or "Token Level Distribution") and temperature (0.6 or 1.0). Titles are positioned at the top-center of each chart.
* **Pie Chart:** Represents the proportional distribution of the four categories.
* **Labels:** Each slice is labeled with the category name and a numerical value (e.g., "math 45.4k (43.3%)"). The numerical value is presented in both raw count (e.g., 45.4k) and percentage (e.g., 43.3%).
* **Categories:** The four categories are "instruction following", "math", "science", and "code".
* **Color Coding:**
* "instruction following": Light Yellow
* "math": Orange
* "science": Blue-Gray
* "code": Light Blue
### Detailed Analysis or Content Details
**Chart 1: Instance Level Distribution, temperature = 0.6**
* "instruction following": 17.6k (17.8%)
* "math": 45.4k (43.3%)
* "science": 19.8k (18.9%)
* "code": 20.1k (19.2%)
**Chart 2: Token Level Distribution, temperature = 0.6**
* "instruction following": 147.2M (10.2%)
* "math": 873.3M (60.4%)
* "science": 53.7M (3.7%)
* "code": 371.2M (25.7%)
**Chart 3: Instance Level Distribution, temperature = 1.0**
* "instruction following": 70k (21.2%)
* "math": 103.3k (31.3%)
* "science": 65.2k (19.8%)
* "code": 91.3k (27.7%)
**Chart 4: Token Level Distribution, temperature = 1.0**
* "instruction following": 186.6M (3.2%)
* "math": 2.4G (41.2%)
* "science": 681M (11.8%)
* "code": 2.5G (43.7%)
### Key Observations
* **Math Dominance:** In all charts, "math" consistently represents the largest proportion of the data, especially at the token level.
* **Temperature Effect:** Increasing the temperature from 0.6 to 1.0 appears to shift the distribution. At the instance level, the proportion of "instruction following" increases, while the proportion of "math" decreases. At the token level, the proportion of "instruction following" decreases, while the proportion of "code" increases.
* **Level Effect:** The "Token Level" distributions have significantly different magnitudes compared to the "Instance Level" distributions. The token level values are orders of magnitude larger.
* **Code Proportion:** The proportion of "code" is relatively stable across the instance level charts, but increases significantly at the token level when the temperature is increased to 1.0.
### Interpretation
These charts likely represent the composition of a dataset used for training or evaluating a language model. The categories ("instruction following", "math", "science", "code") represent the types of content within the dataset. The "temperature" parameter likely controls the randomness or creativity of the model's output.
The dominance of "math" suggests that the dataset is heavily weighted towards mathematical content. The differences between "Instance Level" and "Token Level" distributions indicate that while individual instances may be diverse, the overall token distribution is skewed towards "math".
The temperature effect suggests that higher temperatures lead to more diverse outputs, with a greater emphasis on "code" at the token level. This could be because higher temperatures encourage the model to explore more complex and potentially code-related patterns. The increase in "instruction following" at the instance level with higher temperature could indicate the model is better at following instructions when more randomness is introduced.
The large difference in scale between instance and token level suggests that individual instances are relatively short, while the overall dataset contains a large number of tokens. This could be due to the nature of the data (e.g., short instructions paired with long mathematical derivations).