\n
## Pie Charts: Instance and Token Level Distributions at Different Temperatures
### Overview
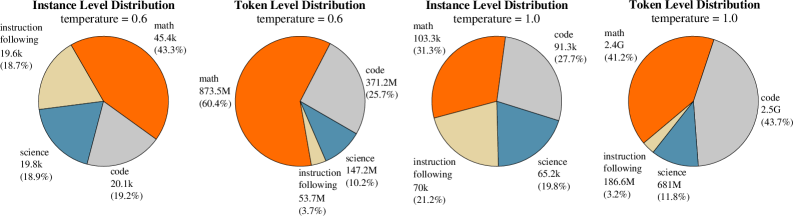
The image displays four pie charts arranged in a 2x2 grid. They compare the distribution of data across four categories ("math", "code", "science", "instruction following") at two different levels of analysis ("Instance Level" and "Token Level") and under two different "temperature" settings (0.6 and 1.0). The charts illustrate how the proportional composition of the dataset changes with the temperature parameter.
### Components/Axes
* **Chart Type:** Pie Charts (4 total).
* **Titles:** Each chart has a two-line title indicating the analysis level and temperature.
* Top-Left: `Instance Level Distribution` / `temperature = 0.6`
* Top-Right: `Token Level Distribution` / `temperature = 0.6`
* Bottom-Left: `Instance Level Distribution` / `temperature = 1.0`
* Bottom-Right: `Token Level Distribution` / `temperature = 1.0`
* **Legend/Categories:** The same four categories are used in all charts, represented by consistent colors:
* **Orange:** `math`
* **Gray:** `code`
* **Blue:** `science`
* **Beige/Light Yellow:** `instruction following`
* **Data Labels:** Each pie slice is labeled with the category name, an absolute numerical value (with 'k' for thousands, 'M' for millions, 'G' for billions), and a percentage in parentheses.
### Detailed Analysis
#### Chart 1: Instance Level Distribution (temperature = 0.6) - Top-Left
* **math (Orange):** 45.4k instances (43.3%). This is the largest slice, positioned from the top-center extending clockwise.
* **code (Gray):** 20.1k instances (19.2%). Positioned in the bottom-right quadrant.
* **science (Blue):** 19.8k instances (18.9%). Positioned in the bottom-left quadrant.
* **instruction following (Beige):** 19.6k instances (18.7%). Positioned in the top-left quadrant.
* **Total Instances (Approximate):** 104.9k.
#### Chart 2: Token Level Distribution (temperature = 0.6) - Top-Right
* **math (Orange):** 873.5M tokens (60.4%). Dominates the chart, occupying the entire left half and more.
* **code (Gray):** 371.2M tokens (25.7%). The second-largest slice, in the top-right quadrant.
* **science (Blue):** 147.2M tokens (10.2%). A smaller slice in the bottom-right.
* **instruction following (Beige):** 53.7M tokens (3.7%). The smallest slice, a thin wedge at the bottom.
* **Total Tokens (Approximate):** 1.445 Billion.
#### Chart 3: Instance Level Distribution (temperature = 1.0) - Bottom-Left
* **math (Orange):** 103.3k instances (31.3%). Still the largest slice but proportionally smaller than at temp=0.6. Positioned top-center.
* **code (Gray):** 91.3k instances (27.7%). Significantly larger share than at temp=0.6. Positioned in the right half.
* **science (Blue):** 65.2k instances (19.8%). Slightly larger share. Positioned in the bottom-left.
* **instruction following (Beige):** 70k instances (21.2%). Larger share. Positioned in the top-left.
* **Total Instances (Approximate):** 329.8k. The total number of instances is notably higher at temperature 1.0.
#### Chart 4: Token Level Distribution (temperature = 1.0) - Bottom-Right
* **math (Orange):** 2.4G tokens (41.2%). Still the largest category but its dominance is greatly reduced compared to temp=0.6. Occupies the top-left portion.
* **code (Gray):** 2.5G tokens (43.7%). Now the largest category by token count, a dramatic increase. Occupies the entire right half.
* **science (Blue):** 681M tokens (11.8%). Slightly larger share. Positioned at the bottom.
* **instruction following (Beige):** 186.6M tokens (3.2%). Similar small share. A thin wedge between math and science.
* **Total Tokens (Approximate):** 5.768 Billion. The total token count is substantially higher at temperature 1.0.
### Key Observations
1. **Temperature Effect on Distribution:** Increasing the temperature from 0.6 to 1.0 causes a major shift in the data distribution. The dominance of "math" decreases significantly, while "code" becomes much more prominent, especially at the token level where it surpasses math.
2. **Instance vs. Token Disparity:** At temperature 0.6, "math" instances (43.3%) account for a vastly disproportionate share of tokens (60.4%), suggesting math instances are, on average, much longer. Conversely, "instruction following" instances (18.7%) account for a tiny fraction of tokens (3.7%), indicating they are very short.
3. **Scale Increase at Higher Temperature:** Both the total number of instances (~3.1x) and total tokens (~4.0x) are substantially higher at temperature 1.0, indicating the generation process produced more and/or longer outputs.
4. **Category Resilience:** The "science" category maintains a relatively stable proportion (18.9% to 19.8% of instances, 10.2% to 11.8% of tokens) across both temperatures.
### Interpretation
This data visualizes the impact of the "temperature" parameter (a setting that controls randomness/creativity in AI model outputs) on the composition of a generated dataset.
* **Lower Temperature (0.6):** Favors "math" content. The model produces outputs that are heavily skewed towards mathematical problems and solutions, and these outputs are particularly lengthy (high token-to-instance ratio). This suggests a more focused, deterministic, and perhaps repetitive generation mode.
* **Higher Temperature (1.0):** Encourages diversity. The output distribution becomes more balanced, with "code" generation becoming the primary activity by volume (tokens). The significant increase in total output volume suggests the model is more prolific and exploratory at this setting. The drastic reduction in the token share of "math" implies that while math problems are still generated, the model's responses to them are likely shorter or less elaborated compared to the code it writes.
**In essence, the charts demonstrate that tuning the temperature parameter doesn't just change the style of output, but fundamentally alters the topical focus and structural length of the generated content, shifting from lengthy, math-heavy responses at low temperature to voluminous, code-centric outputs at higher temperature.**