## Pie Charts: Instance Level vs Token Level Distribution at Temperatures 0.6 and 1.0
### Overview
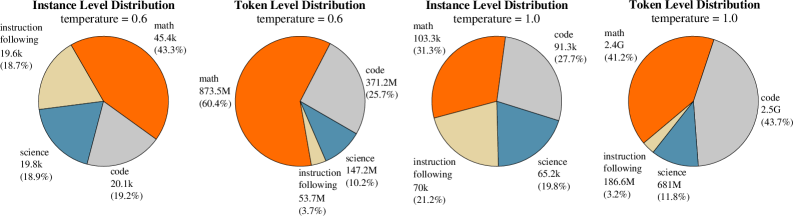
The image contains four pie charts comparing **instance-level** and **token-level** distributions across four categories: **math**, **code**, **science**, and **instruction following**. Two sets of charts are presented for temperatures **0.6** and **1.0**, highlighting how distribution proportions shift with temperature changes.
---
### Components/Axes
1. **Legend**:
- Colors:
- **Orange** = Math
- **Gray** = Code
- **Blue** = Science
- **Yellow** = Instruction Following
- Positioned on the left side of each chart.
2. **Axes**:
- **X/Y Axes**: Not applicable (pie charts).
- **Labels**:
- Categories (math, code, science, instruction following) with counts and percentages.
- Temperature values (0.6 and 1.0) in chart titles.
---
### Detailed Analysis
#### Temperature = 0.6
- **Instance Level Distribution**:
- Math: 45.4k (43.3%)
- Code: 20.1k (19.2%)
- Science: 19.8k (18.9%)
- Instruction Following: 19.6k (18.7%)
- **Token Level Distribution**:
- Math: 873.5M (60.4%)
- Code: 371.2M (25.7%)
- Science: 147.2M (10.2%)
- Instruction Following: 53.7M (3.7%)
#### Temperature = 1.0
- **Instance Level Distribution**:
- Math: 103.3k (31.3%)
- Code: 91.3k (27.7%)
- Science: 65.2k (19.8%)
- Instruction Following: 70k (21.2%)
- **Token Level Distribution**:
- Math: 2.4G (41.2%)
- Code: 2.5G (43.7%)
- Science: 681M (11.8%)
- Instruction Following: 186.6M (3.2%)
---
### Key Observations
1. **Math Dominance**:
- At both temperatures, **math** dominates **token-level** distributions (60.4% at 0.6, 41.2% at 1.0), far exceeding instance-level proportions (43.3% at 0.6, 31.3% at 1.0).
- Token-level math counts increase dramatically with temperature (873.5M → 2.4G).
2. **Code Growth**:
- **Code** token-level distribution grows significantly with temperature (371.2M → 2.5G), surpassing math at 1.0 (43.7% vs. 41.2%).
3. **Instruction Following**:
- Token-level counts for **instruction following** surge with temperature (53.7M → 186.6M), but its proportion remains low (3.7% → 3.2%).
4. **Science**:
- **Science** token-level distribution grows modestly (147.2M → 681M), with a slight drop in proportion (10.2% → 11.8%).
---
### Interpretation
- **Temperature Impact**:
- Higher temperature (1.0) reduces math's relative dominance in **instance-level** distributions but amplifies its token-level usage. This suggests temperature may prioritize math-heavy tasks at the token level.
- **Code** becomes more prominent in token-level distributions at higher temperatures, indicating increased focus on coding tasks.
- **Instruction following** token counts rise sharply with temperature, but its low proportion suggests it remains a minor component despite increased usage.
- **Implications**:
- The disparity between instance-level and token-level distributions highlights how computational resources (tokens) are disproportionately allocated to math and code tasks, even when their instance-level frequency is lower.
- The near-equal token-level proportions of math and code at 1.0 (41.2% vs. 43.7%) suggest a balance in resource allocation for these domains at higher temperatures.
- **Anomalies**:
- **Instruction following** token counts increase 3.4x with temperature, yet its proportion remains negligible, indicating inefficiency in token utilization for this category.