# Technical Document Extraction: 2D Dimensionality Reduction Plot
## 1. Image Overview
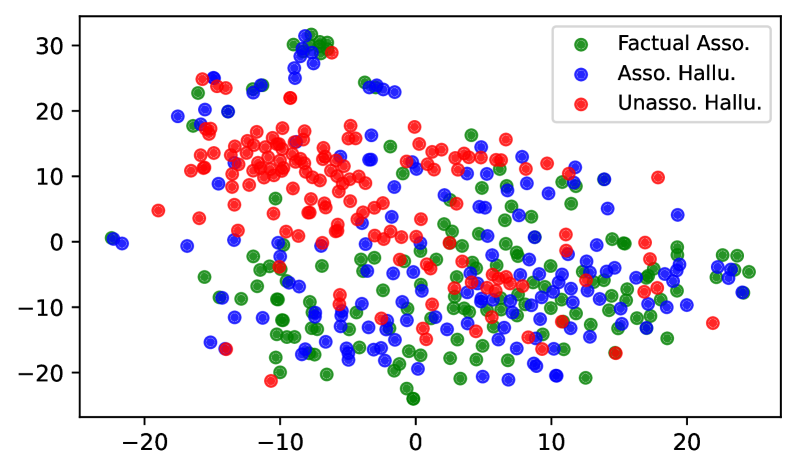
This image is a scatter plot representing a 2D dimensionality reduction (likely t-SNE or UMAP) of data points categorized into three distinct classes. The plot visualizes the clustering and overlap of different types of model outputs or associations.
## 2. Component Isolation
### A. Header/Legend
* **Location:** Top-right corner [approx. x=0.7 to 0.95, y=0.75 to 0.95 in normalized coordinates].
* **Legend Items:**
* **Green Circle ($\bullet$):** Factual Asso. (Factual Association)
* **Blue Circle ($\bullet$):** Asso. Hallu. (Associative Hallucination)
* **Red Circle ($\bullet$):** Unasso. Hallu. (Unassociative Hallucination)
### B. Main Chart Area (Axes)
* **X-Axis:** Numerical scale ranging from approximately **-25 to +25**. Major tick marks are labeled at **-20, -10, 0, 10, 20**.
* **Y-Axis:** Numerical scale ranging from approximately **-30 to +35**. Major tick marks are labeled at **-20, -10, 0, 10, 20, 30**.
* **Data Points:** Semi-transparent circular markers. Overlapping points create darker, more opaque regions.
---
## 3. Data Series Analysis and Trends
### Series 1: Factual Asso. (Green)
* **Visual Trend:** This series is widely dispersed across the lower half and right side of the plot. It shows significant overlap with the "Asso. Hallu." (Blue) series.
* **Spatial Distribution:**
* Concentrated primarily between $x \in [-15, 25]$ and $y \in [-25, 10]$.
* A small, dense cluster is visible at the top center-left near $x \approx -8, y \approx 30$.
* Scattered outliers exist on the far right edge ($x \approx 25, y \approx -5$).
### Series 2: Asso. Hallu. (Blue)
* **Visual Trend:** Highly interleaved with the Green series, suggesting these two categories share similar feature spaces or embeddings.
* **Spatial Distribution:**
* Broadly distributed across the entire range of the x-axis.
* Dense clusters appear at $x \approx -8, y \approx 30$ (overlapping with Green) and $x \approx -2, y \approx 24$.
* Significant presence in the lower-right quadrant ($x > 0, y < 0$).
### Series 3: Unasso. Hallu. (Red)
* **Visual Trend:** Shows a distinct, localized "cloud" or cluster that is partially separated from the main mass of the other two categories.
* **Spatial Distribution:**
* Primary cluster is located in the upper-left quadrant, specifically between $x \in [-15, -5]$ and $y \in [10, 18]$.
* Secondary scattering occurs across the center ($y \approx 0$ to $10$).
* Relatively few points are found in the bottom-right quadrant compared to the Green and Blue series.
---
## 4. Key Observations and Data Patterns
1. **Clustering:** There is a notable cluster of "Unasso. Hallu." (Red) in the top-left that is relatively pure, indicating these instances have distinct characteristics from factual associations.
2. **Overlap:** The "Factual Asso." (Green) and "Asso. Hallu." (Blue) categories are heavily mixed, particularly in the region where $x > 0$. This suggests that the model's internal representation of factual data and associative hallucinations are very similar.
3. **Outliers:** There are isolated points of all three colors on the far left ($x \approx -22, y \approx 0$), indicating a small group of data points that are mathematically distant from the main distribution.
4. **Density:** The highest density of points occurs in the central-lower region ($x \in [-10, 15], y \in [-15, 5]$), where all three categories converge.