## Scatter Plot: Distribution of Association Categories
### Overview
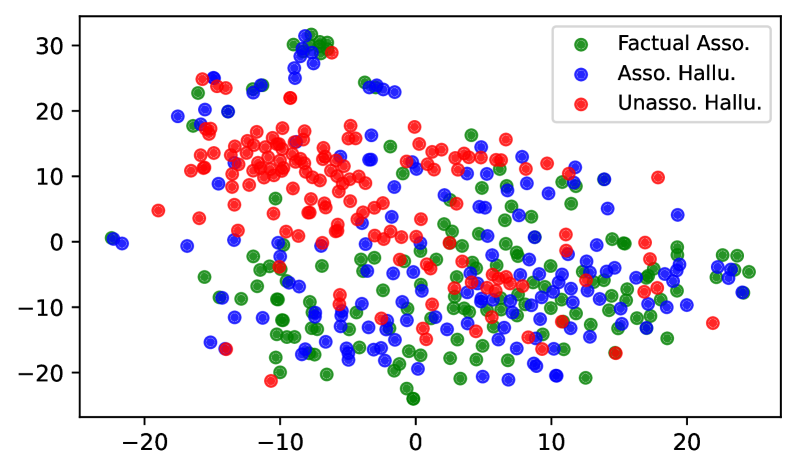
The image is a scatter plot displaying three distinct categories of data points: "Factual Asso." (green), "Asso. Hallu." (blue), and "Unasso. Hallu." (red). The plot spans a 2D coordinate system with X and Y axes ranging from -20 to 30. Data points are distributed across the plot, with varying densities and spatial groupings.
### Components/Axes
- **X-axis**: Labeled "X" with a range from -20 to 30. No explicit units or labels beyond the axis title.
- **Y-axis**: Labeled "Y" with a range from -20 to 30. No explicit units or labels beyond the axis title.
- **Legend**: Located in the **top-right corner** of the plot. It includes:
- **Green**: "Factual Asso."
- **Blue**: "Asso. Hallu."
- **Red**: "Unasso. Hallu."
### Detailed Analysis
- **Factual Asso. (Green)**:
- Clustered primarily in the **top-left quadrant** (X ≈ -10 to 0, Y ≈ 10 to 30).
- Some points extend into the **center** (X ≈ 0 to 10, Y ≈ 0 to 10).
- Density decreases toward the **bottom-right** (X ≈ 10 to 20, Y ≈ -10 to 0).
- **Asso. Hallu. (Blue)**:
- Concentrated in the **top-right quadrant** (X ≈ 0 to 20, Y ≈ 10 to 30).
- Some points spread into the **center** (X ≈ -10 to 0, Y ≈ 0 to 10).
- Fewer points in the **bottom-left** (X ≈ -20 to -10, Y ≈ -20 to -10).
- **Unasso. Hallu. (Red)**:
- Widely distributed across the entire plot, with no clear clustering.
- High density in the **center** (X ≈ -10 to 10, Y ≈ -10 to 10).
- Scattered points in all quadrants, including the **bottom-left** (X ≈ -20 to -10, Y ≈ -20 to -10) and **top-right** (X ≈ 10 to 20, Y ≈ 10 to 30).
### Key Observations
1. **Factual Asso.** exhibits a strong spatial bias toward the **top-left**, suggesting a potential correlation with higher Y-values and lower X-values.
2. **Asso. Hallu.** is predominantly in the **top-right**, indicating a possible inverse relationship with Factual Asso. in terms of X and Y coordinates.
3. **Unasso. Hallu.** shows the most dispersed distribution, with no clear pattern, implying a lack of strong association with specific X/Y ranges.
4. **Overlap**: All three categories overlap in the **center** (X ≈ -10 to 10, Y ≈ -10 to 10), suggesting ambiguity or mixed associations in this region.
### Interpretation
The plot likely represents a classification or clustering of entities based on two dimensions (X and Y). The distinct spatial groupings of "Factual Asso." and "Asso. Hallu." suggest that these categories may be influenced by opposing factors (e.g., X and Y values). The "Unasso. Hallu." category, being more dispersed, might represent outliers or entities with weaker or undefined associations. The overlap in the center highlights potential ambiguity or transitional states between categories. This could reflect a dataset where certain attributes (X and Y) are used to differentiate between factual, associated, and unassociated hallucinations, though the exact nature of the axes remains unspecified.