# Technical Document Extraction: Distributed System Sharding Diagram
## 1. Overview
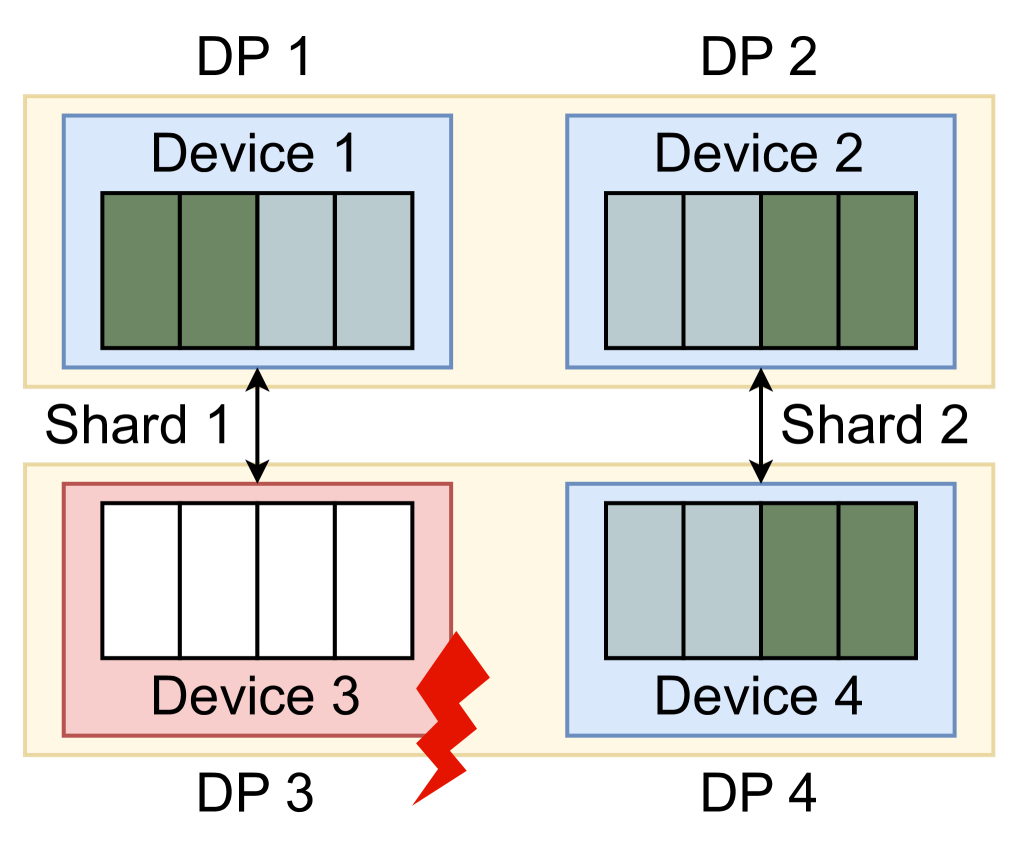
This image is a technical architectural diagram illustrating a distributed computing or storage system utilizing sharding and data parallelism (DP). It depicts four Data Parallel (DP) units, each containing a device, and shows the distribution of data shards across these devices. The diagram specifically highlights a failure state in one of the devices.
## 2. Component Isolation
### Region A: Top Row (Active/Healthy)
* **DP 1 (Top Left):** Contains **Device 1**.
* **Internal State:** Contains four data slots. The first two slots (left) are filled with dark green blocks. The last two slots (right) are filled with light grey blocks.
* **DP 2 (Top Right):** Contains **Device 2**.
* **Internal State:** Contains four data slots. The first two slots (left) are filled with light grey blocks. The last two slots (right) are filled with dark green blocks.
### Region B: Bottom Row (Mixed State)
* **DP 3 (Bottom Left):** Contains **Device 3**.
* **Internal State:** This device is highlighted with a **red border and light red background**. It contains four data slots, all of which are **empty (white)**.
* **Status Indicator:** A red lightning bolt icon is positioned at the bottom right corner of Device 3, indicating a hardware or software failure.
* **DP 4 (Bottom Right):** Contains **Device 4**.
* **Internal State:** Contains four data slots. The first two slots (left) are filled with light grey blocks. The last two slots (right) are filled with dark green blocks.
### Region C: Interconnects and Sharding Labels
* **Shard 1:** Indicated by a vertical double-headed black arrow connecting the DP 1/Device 1 block to the DP 3/Device 3 block.
* **Shard 2:** Indicated by a vertical double-headed black arrow connecting the DP 2/Device 2 block to the DP 4/Device 4 block.
---
## 3. Data and Shard Mapping
The diagram uses color coding to represent data distribution across the shards.
| Component | Shard Association | Slot 1 | Slot 2 | Slot 3 | Slot 4 | Status |
| :--- | :--- | :--- | :--- | :--- | :--- | :--- |
| **Device 1** | Shard 1 | Dark Green | Dark Green | Light Grey | Light Grey | Healthy |
| **Device 2** | Shard 2 | Light Grey | Light Grey | Dark Green | Dark Green | Healthy |
| **Device 3** | Shard 1 | Empty | Empty | Empty | Empty | **FAILED** |
| **Device 4** | Shard 2 | Light Grey | Light Grey | Dark Green | Dark Green | Healthy |
---
## 4. Technical Analysis and Flow
* **Sharding Logic:** The system is divided into at least two shards. Shard 1 encompasses DP 1 and DP 3. Shard 2 encompasses DP 2 and DP 4.
* **Data Redundancy/Parallelism:**
* In Shard 2, Device 2 and Device 4 contain identical data patterns (Light Grey in slots 1-2, Dark Green in slots 3-4), suggesting a mirrored or replicated state.
* In Shard 1, Device 1 holds data, but Device 3 is empty and marked with a failure symbol. This implies that the data intended for DP 3 is lost, inaccessible, or failed to load due to the device fault.
* **Visual Trends:**
* **Healthy Devices (1, 2, 4):** Represented with blue borders and light blue backgrounds.
* **Failed Device (3):** Represented with a red border/background and a lightning bolt, signifying a critical error in the Shard 1 pipeline.
## 5. Textual Transcription
The following text strings are present in the image:
* **DP 1**
* **DP 2**
* **DP 3**
* **DP 4**
* **Device 1**
* **Device 2**
* **Device 3**
* **Device 4**
* **Shard 1**
* **Shard 2**