# Technical Document Extraction: Device Configuration Diagram
## Overview
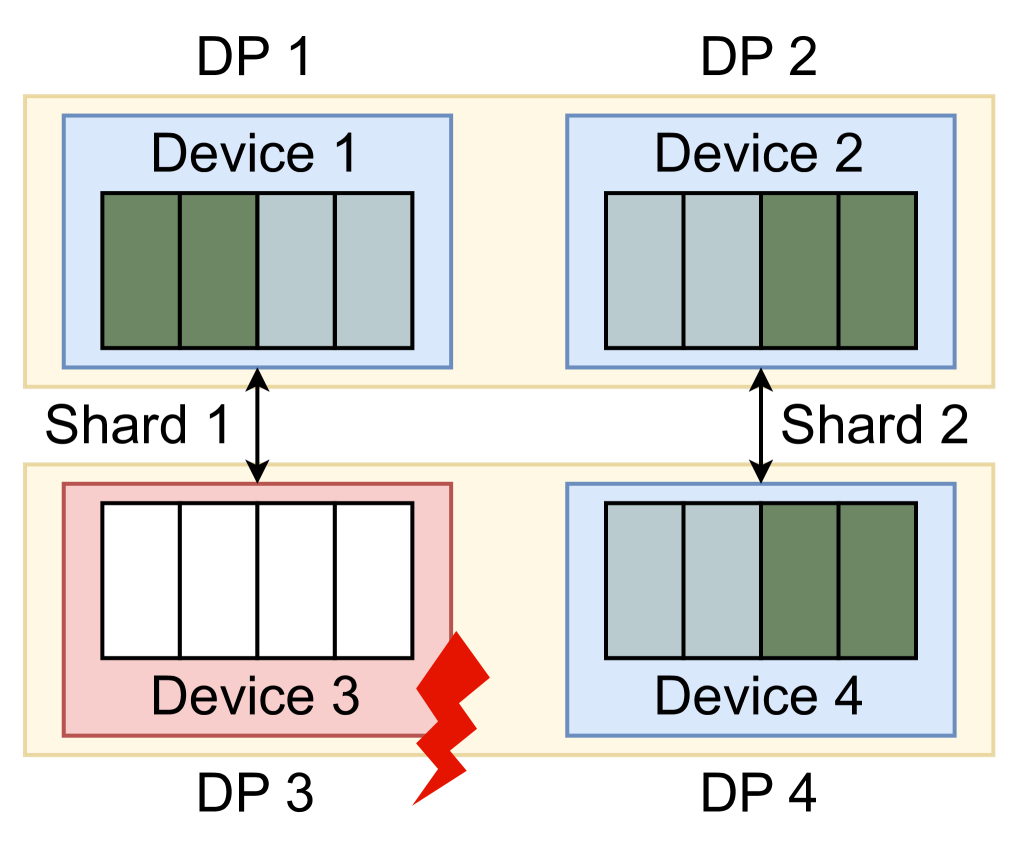
The diagram illustrates a distributed system architecture with four devices (Device 1–4) connected to four data processing units (DP 1–4). Key components include color-coded status indicators, directional shards, and a fault indicator.
---
### **Component Breakdown**
#### **1. Data Processing Units (DPs)**
- **DP 1** (Top-left): Connected to Device 1 via Shard 1.
- **DP 2** (Top-right): Connected to Device 2 via Shard 2.
- **DP 3** (Bottom-left): Connected to Device 3 (fault state).
- **DP 4** (Bottom-right): Connected to Device 4.
#### **2. Devices**
Each device contains a 2x2 grid of status indicators:
- **Device 1** (DP 1):
- Grid: `[Green, Green, Gray, Gray]` (left-to-right, top-to-bottom).
- **Device 2** (DP 2):
- Grid: `[Gray, Gray, Green, Green]`.
- **Device 3** (DP 3):
- Grid: `[White, White, White, White]` with a **red lightning bolt** (fault indicator).
- **Device 4** (DP 4):
- Grid: `[Gray, Gray, Green, Green]`.
#### **3. Shards**
- **Shard 1**: Vertical arrow connecting DP 1 → Device 1.
- **Shard 2**: Vertical arrow connecting DP 2 → Device 2.
---
### **Color Coding & Status Inference**
- **Green**: Active/operational status (Devices 1, 2, 4).
- **Gray**: Inactive/standby status (Devices 1, 2, 4).
- **White**: Offline/non-responsive (Device 3).
- **Red Lightning Bolt**: Critical fault/error state (Device 3).
---
### **Spatial Grounding**
- **Legend**: No explicit legend present. Color coding inferred from standard technical conventions.
- **Shard Placement**:
- Shard 1: Centered between DP 1 and Device 1.
- Shard 2: Centered between DP 2 and Device 2.
- **Fault Indicator**: Red lightning bolt located at the bottom-right corner of Device 3’s grid.
---
### **Trend Analysis**
- **Device 3 (DP 3)**: Entirely white grid with a red fault indicator suggests a system-wide failure or outage.
- **Shard Connections**: Unidirectional flow from DPs to Devices (DP → Device), implying data processing dependency.
---
### **Critical Observations**
1. **Fault Propagation**: Device 3’s fault state (red lightning bolt) may impact connected systems (DP 3).
2. **Redundancy**: Devices 2 and 4 share identical grid configurations, suggesting mirrored roles.
3. **Shard Functionality**: Shards likely represent data pipelines or control links between DPs and Devices.
---
### **Textual Labels**
- **DPs**: DP 1, DP 2, DP 3, DP 4.
- **Devices**: Device 1, Device 2, Device 3, Device 4.
- **Shards**: Shard 1, Shard 2.
- **Fault Indicator**: Red lightning bolt (no explicit label).
---
### **Conclusion**
The diagram depicts a fault-tolerant system where Devices 1, 2, and 4 operate normally (green/gray grids), while Device 3 is in a critical fault state. Shards define directional dependencies between DPs and Devices, with Device 3’s failure potentially disrupting DP 3 operations.