TECHNICAL ASSET FINGERPRINT
5f684bbfe9b179ea1a67fa18
Click to view fullscreen
Press ESC or click to close
FOUND IN PAPERS
EXPERT: healer-alpha-free VERSION 1
RUNTIME: free/openrouter/healer-alpha
INTEL_VERIFIED
## Scatter Plot: Model Performance Comparison on AIME24 vs. OlymMATH EN Datasets
### Overview
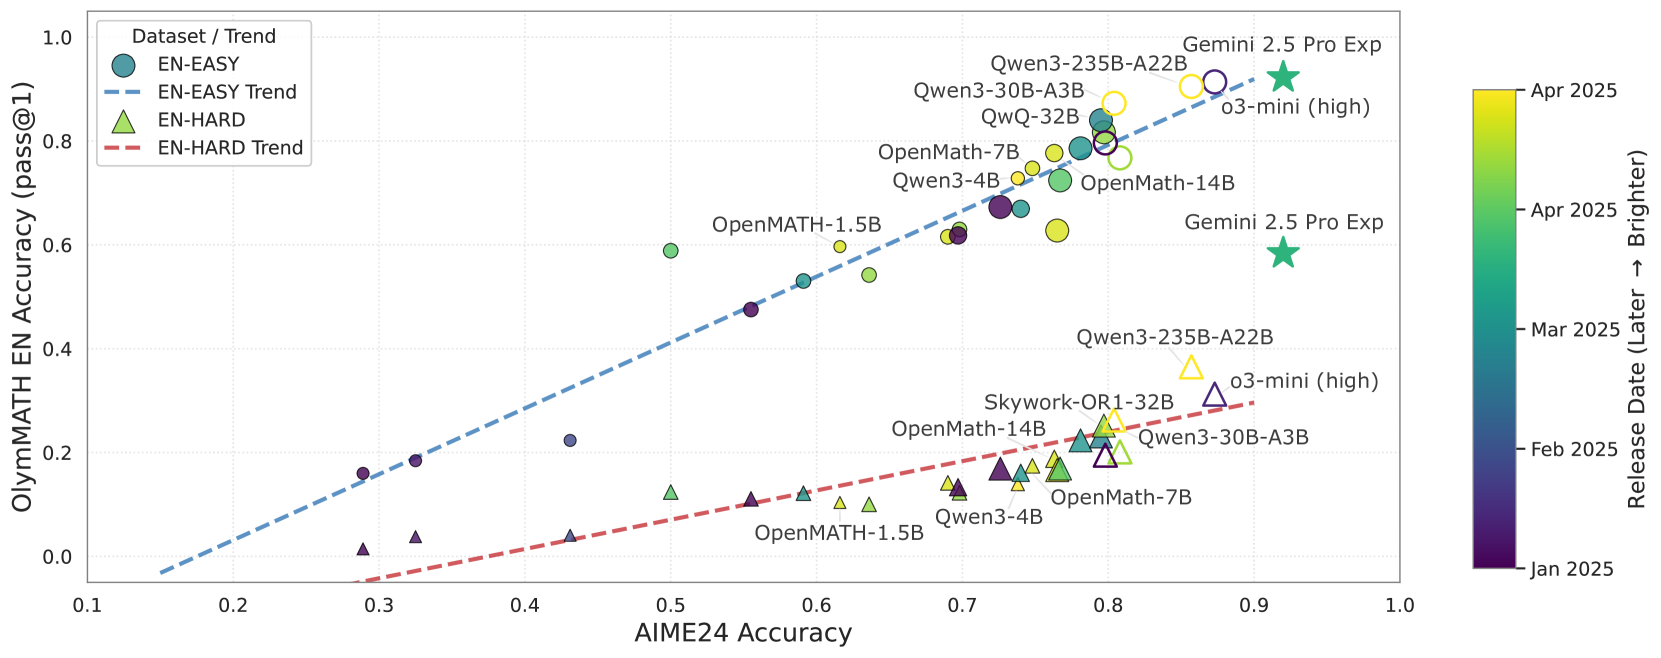
This image is a scatter plot comparing the performance of various AI models on two different mathematics benchmarks: AIME24 Accuracy (x-axis) and OlymMATH EN Accuracy (pass@1) (y-axis). Data points are colored according to their release date, with a color gradient bar on the right indicating the timeline from January 2025 (dark purple) to April 2025 (bright yellow). Two distinct datasets are plotted: "EN-EASY" (represented by circles) and "EN-HARD" (represented by triangles), each with a corresponding linear trend line.
### Components/Axes
* **X-Axis:** "AIME24 Accuracy". Scale ranges from 0.1 to 1.0, with major tick marks at 0.1 intervals.
* **Y-Axis:** "OlymMATH EN Accuracy (pass@1)". Scale ranges from 0.0 to 1.0, with major tick marks at 0.2 intervals.
* **Legend (Top-Left Corner):**
* **Dataset / Trend**
* `EN-EASY`: Represented by a teal circle.
* `EN-EASY Trend`: Represented by a blue dashed line.
* `EN-HARD`: Represented by a light green triangle.
* `EN-HARD Trend`: Represented by a red dashed line.
* **Color Bar (Right Side):** Labeled "Release Date (Later → Brighter)". The gradient runs from dark purple (Jan 2025) through teal and green to bright yellow (Apr 2025).
* **Data Points:** Each point is labeled with a model name. Points are either circles (EN-EASY) or triangles (EN-HARD) and are filled with a color corresponding to their release date.
### Detailed Analysis
**Data Series & Trends:**
1. **EN-EASY Trend (Blue Dashed Line):** Shows a strong positive linear correlation. The line slopes steeply upward from the bottom-left to the top-right of the chart.
2. **EN-HARD Trend (Red Dashed Line):** Also shows a positive linear correlation, but with a shallower slope compared to the EN-EASY trend. It starts near the origin and rises more gradually.
**Data Points (Approximate Coordinates & Release Date Inference):**
*Coordinates are (AIME24 Accuracy, OlymMATH EN Accuracy). Release date is inferred from point color.*
* **Top-Right Cluster (High Performance on Both Benchmarks):**
* `Gemini 2.5 Pro Exp` (Star, ~0.92, ~0.92) - Bright green (Late Mar/Early Apr 2025).
* `o3-mini (high)` (Circle, ~0.88, ~0.85) - Yellow (Apr 2025).
* `Qwen3-235B-A22B` (Circle, ~0.85, ~0.88) - Yellow (Apr 2025).
* `Qwen3-30B-A3B` (Circle, ~0.82, ~0.82) - Yellow-green (Late Mar 2025).
* `QwQ-32B` (Circle, ~0.80, ~0.80) - Green (Mar 2025).
* `OpenMath-14B` (Circle, ~0.78, ~0.72) - Green (Mar 2025).
* `OpenMath-7B` (Circle, ~0.76, ~0.78) - Green (Mar 2025).
* `Qwen3-4B` (Circle, ~0.74, ~0.75) - Green (Mar 2025).
* **Mid-Range Cluster:**
* `OpenMATH-1.5B` (Circle, ~0.62, ~0.60) - Light green (Early Mar 2025).
* `OpenMATH-1.5B` (Circle, ~0.58, ~0.54) - Teal (Late Feb 2025).
* `OpenMATH-1.5B` (Circle, ~0.50, ~0.59) - Teal (Late Feb 2025).
* `Qwen3-4B` (Circle, ~0.69, ~0.62) - Purple (Feb 2025).
* `OpenMath-7B` (Circle, ~0.70, ~0.68) - Purple (Feb 2025).
* **Lower-Left Points (Lower Performance):**
* Several unlabeled circles and triangles with AIME24 Accuracy between 0.25-0.45 and OlymMATH Accuracy between 0.0-0.25. Colors are dark purple/blue, indicating release in Jan/Feb 2025.
* **EN-HARD Dataset Points (Triangles):**
* `Gemini 2.5 Pro Exp` (Star, ~0.92, ~0.58) - Bright green (Late Mar/Early Apr 2025).
* `o3-mini (high)` (Triangle, ~0.87, ~0.30) - Yellow (Apr 2025).
* `Qwen3-235B-A22B` (Triangle, ~0.85, ~0.36) - Yellow (Apr 2025).
* `Skywork-OR1-32B` (Triangle, ~0.80, ~0.24) - Yellow-green (Late Mar 2025).
* `OpenMath-14B` (Triangle, ~0.79, ~0.22) - Green (Mar 2025).
* `Qwen3-30B-A3B` (Triangle, ~0.81, ~0.20) - Green (Mar 2025).
* `OpenMath-7B` (Triangle, ~0.77, ~0.16) - Green (Mar 2025).
* `Qwen3-4B` (Triangle, ~0.70, ~0.14) - Purple (Feb 2025).
* `OpenMATH-1.5B` (Triangle, ~0.63, ~0.10) - Teal (Late Feb 2025).
* `OpenMATH-1.5B` (Triangle, ~0.59, ~0.12) - Teal (Late Feb 2025).
* `OpenMATH-1.5B` (Triangle, ~0.50, ~0.12) - Teal (Late Feb 2025).
* Several unlabeled triangles with AIME24 Accuracy between 0.28-0.43 and OlymMATH Accuracy near 0.0-0.05. Colors are dark purple (Jan 2025).
### Key Observations
1. **Positive Correlation:** There is a clear positive correlation between performance on AIME24 and OlymMATH EN for both the EASY and HARD datasets. Models that score higher on one tend to score higher on the other.
2. **Performance Gap:** The EN-EASY dataset yields significantly higher OlymMATH scores than the EN-HARD dataset for the same models. The vertical gap between the two trend lines is substantial.
3. **Temporal Trend:** Brighter-colored points (more recent releases, Mar-Apr 2025) are generally clustered in the upper-right quadrant, indicating that newer models tend to achieve higher accuracy on both benchmarks.
4. **Outlier:** `Gemini 2.5 Pro Exp` is a notable outlier, achieving the highest or near-highest scores on both datasets within its release timeframe.
5. **Model Clustering:** Models from the same family (e.g., OpenMath, Qwen3) often appear in clusters, with larger or newer variants generally performing better.
### Interpretation
This chart demonstrates a strong relationship between a model's capability on the AIME24 competition-style problems and its performance on the OlymMATH EN benchmark. The positive correlation suggests these benchmarks may be measuring overlapping aspects of mathematical reasoning ability.
The significant performance drop from the EN-EASY to EN-HARD datasets indicates that the "HARD" subset presents a substantially greater challenge, likely involving more complex problem types or requiring deeper reasoning. The fact that the trend lines are parallel (both linear) but offset suggests the difficulty increase is consistent across the model performance spectrum.
The temporal trend is a key insight: the field is progressing rapidly, with models released in early 2025 (purple) generally underperforming those released in spring 2025 (yellow/green). This visualizes the pace of advancement in AI mathematical reasoning over a short period.
The clustering of models by family suggests that architectural choices and training methodologies have a consistent impact on performance across different benchmarks. The outlier performance of `Gemini 2.5 Pro Exp` may indicate a significant architectural or training breakthrough relative to its contemporaries.
**Language Declaration:** All text in the image is in English.
DECODING INTELLIGENCE...