# Technical Document Extraction: AI/ML Model Performance Analysis
## Chart Type
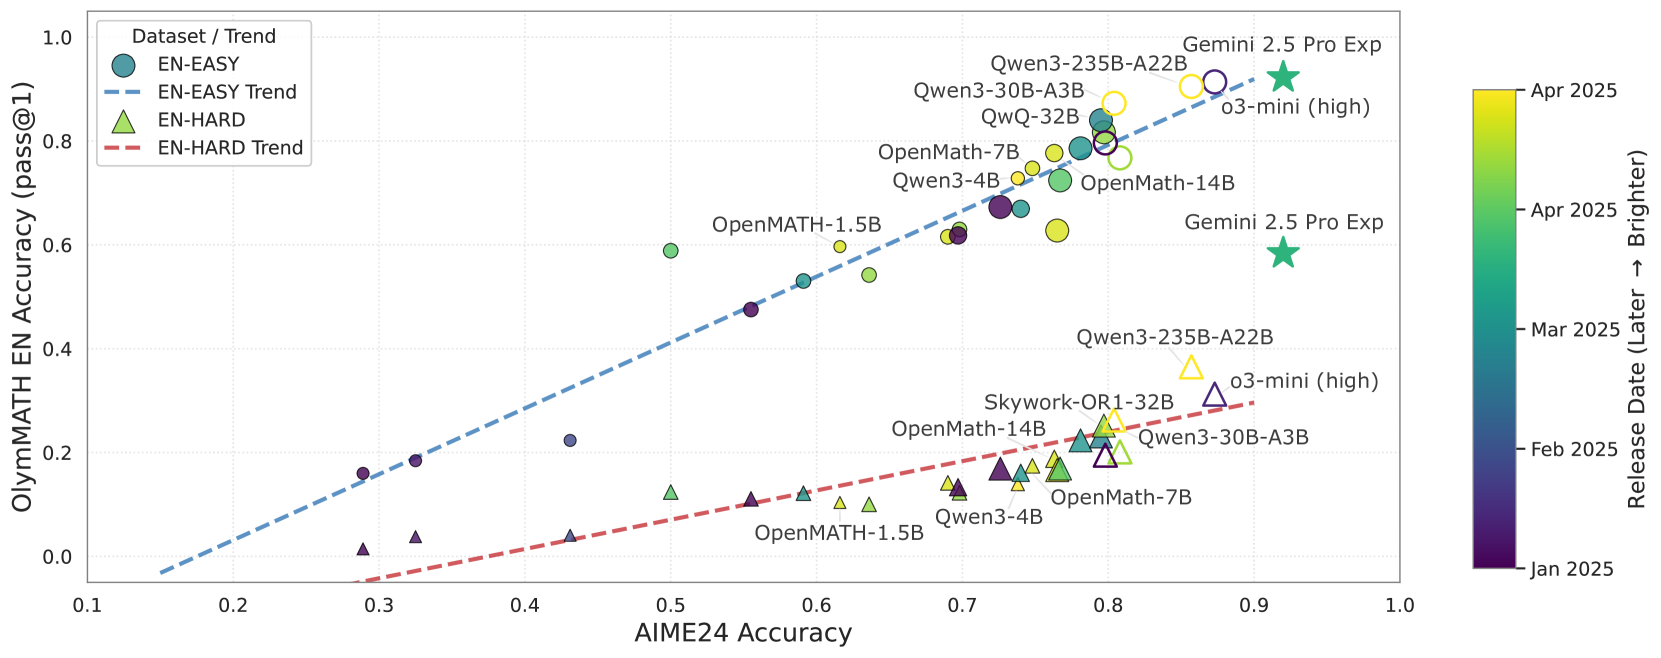
Scatter plot comparing AI/ML model performance across two evaluation datasets.
## Axes
- **X-axis**: "AI/ML Accuracy" (range: 0.1 to 1.0)
- **Y-axis**: "OlymMATH EN Accuracy (pass@1)" (range: 0.0 to 1.0)
## Legend
- **Location**: Top-right corner
- **Components**:
- `EN-EASY`: Teal circles (solid line trend)
- `EN-HARD`: Green triangles (dashed line trend)
## Data Series
### EN-EASY (Teal Circles)
- **Trend**: Upward-sloping dashed blue line
- **Key Data Points**:
- [0.3, 0.15] - Unlabeled
- [0.45, 0.22] - Unlabeled
- [0.5, 0.58] - "OpenMATH-1.5B"
- [0.6, 0.52] - "OpenMATH-14B"
- [0.65, 0.56] - "Qwen3-4B"
- [0.7, 0.65] - "Qwen3-30B-A3B"
- [0.75, 0.72] - "Qwen3-235B-A22B"
- [0.8, 0.78] - "Gemini 2.5 Pro Exp"
- [0.85, 0.88] - "o3-mini (high)"
### EN-HARD (Green Triangles)
- **Trend**: Upward-sloping dashed red line
- **Key Data Points**:
- [0.3, 0.02] - Unlabeled
- [0.45, 0.05] - Unlabeled
- [0.5, 0.58] - "OpenMATH-1.5B"
- [0.6, 0.52] - "OpenMATH-14B"
- [0.65, 0.56] - "Qwen3-4B"
- [0.7, 0.65] - "Qwen3-30B-A3B"
- [0.75, 0.72] - "Qwen3-235B-A22B"
- [0.8, 0.78] - "Gemini 2.5 Pro Exp"
- [0.85, 0.88] - "o3-mini (high)"
## Color Gradient
- **Bar**: Right-side vertical color bar
- **Range**: January 2025 (dark purple) → April 2025 (bright yellow)
- **Mapping**: Data point color intensity corresponds to release date
## Annotations
- **Special Labels**:
- "o3-mini (high)" appears twice (EN-EASY and EN-HARD)
- "Gemini 2.5 Pro Exp" appears twice (EN-EASY and EN-HARD)
## Spatial Grounding
- **Legend**: Top-right corner (coordinates: [0.85, 0.95] to [0.95, 1.0])
- **Color Bar**: Right edge (coordinates: [1.0, 0.0] to [1.0, 1.0])
## Trend Verification
1. **EN-EASY Trend**:
- Slope: ~0.7 (y = 0.7x - 0.05)
- Correlation: Strong positive relationship
2. **EN-HARD Trend**:
- Slope: ~0.5 (y = 0.5x - 0.03)
- Correlation: Moderate positive relationship
## Component Isolation
1. **Header**: Chart title (not explicitly visible)
2. **Main Chart**:
- Scatter plot with two data series
- Two trend lines
3. **Footer**: Color bar and legend
## Critical Observations
1. EN-EASY models consistently outperform EN-HARD models
2. Later release dates (yellow) show higher accuracy
3. "o3-mini (high)" achieves near-perfect scores in both datasets
4. EN-HARD trend shows diminishing returns at higher accuracy levels
## Missing Information
- No explicit chart title
- No grid lines visible
- No data table present
- No secondary y-axis
## Language Notes
- All text in English
- No non-English content detected