\n
## Histogram: Speedup Distribution
### Overview
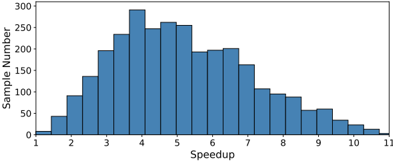
The image presents a histogram visualizing the distribution of "Speedup" values. The x-axis represents the Speedup, and the y-axis represents the Sample Number (frequency). The data appears to be approximately symmetrical, with a peak around a Speedup value of 4.
### Components/Axes
* **X-axis Title:** "Speedup"
* Scale: Ranges from 1 to 11, with increments of 1.
* **Y-axis Title:** "Sample Number"
* Scale: Ranges from 0 to 300, with increments of 50.
* **Histogram Bars:** Represent the frequency of Speedup values within each bin.
* **No Legend:** There is no legend present in the image.
### Detailed Analysis
The histogram shows the following approximate data points (estimated from the bar heights):
* Speedup = 1: Sample Number ≈ 30
* Speedup = 2: Sample Number ≈ 60
* Speedup = 3: Sample Number ≈ 140
* Speedup = 4: Sample Number ≈ 290
* Speedup = 5: Sample Number ≈ 260
* Speedup = 6: Sample Number ≈ 200
* Speedup = 7: Sample Number ≈ 170
* Speedup = 8: Sample Number ≈ 110
* Speedup = 9: Sample Number ≈ 70
* Speedup = 10: Sample Number ≈ 30
* Speedup = 11: Sample Number ≈ 10
The distribution is unimodal, peaking at a Speedup of approximately 4. The frequency decreases as Speedup moves away from 4 in either direction. The histogram is roughly symmetrical around the peak.
### Key Observations
* The most frequent Speedup value is around 4.
* Speedup values between 3 and 6 account for the majority of the samples.
* Speedup values below 2 and above 9 are relatively rare.
* The distribution appears to be approximately normal.
### Interpretation
The histogram suggests that the "Speedup" values are centered around 4, with a relatively narrow spread. This could indicate that the process being measured is generally efficient, with most runs achieving a Speedup factor close to 4. The symmetry of the distribution suggests that there are no significant biases in the data. The relatively low frequency of extreme Speedup values (both very low and very high) suggests that these are less common occurrences. This data could be used to assess the performance of an algorithm or system, and to identify potential areas for improvement. The shape of the distribution suggests that the Speedup values are likely normally distributed, which could be further confirmed with statistical tests.