## Bar Chart: Sample Distribution by Speedup
### Overview
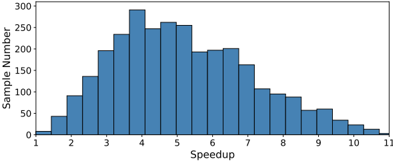
The chart displays a distribution of sample numbers across different speedup values. Speedup is measured on the x-axis (1–11), and sample counts are shown on the y-axis (0–300). The data forms a bell-shaped curve, peaking at mid-range speedup values.
### Components/Axes
- **X-axis (Speedup)**: Labeled "Speedup" with integer values from 1 to 11. No intermediate tick marks or gridlines visible.
- **Y-axis (Sample Number)**: Labeled "Sample Number" with increments of 50 up to 300. No gridlines or secondary axis elements.
- **Bars**: Blue-colored vertical bars represent sample counts for each speedup value. No legend or colorbar present.
- **Title**: No explicit chart title visible in the image.
### Detailed Analysis
- **Speedup 1**: ~10 samples (shortest bar).
- **Speedup 2**: ~40 samples.
- **Speedup 3**: ~140 samples.
- **Speedup 4**: ~280 samples (peak).
- **Speedup 5**: ~260 samples (second peak).
- **Speedup 6**: ~200 samples.
- **Speedup 7**: ~160 samples.
- **Speedup 8**: ~100 samples.
- **Speedup 9**: ~60 samples.
- **Speedup 10**: ~30 samples.
- **Speedup 11**: ~10 samples (shortest bar).
### Key Observations
1. **Bimodal Peak**: Two prominent peaks at speedup 4 (~280 samples) and 5 (~260 samples), suggesting optimal performance clustering in this range.
2. **Rapid Decline**: Sample counts drop sharply beyond speedup 5, with values below 100 for speedups 6–11.
3. **Symmetry**: The distribution is roughly symmetric around speedup 5.5, though the left side (speedups 1–4) shows a steeper rise than the right side (speedups 6–11).
### Interpretation
The data suggests that the majority of samples achieve optimal performance at speedup values 4–5, with diminishing returns at higher speedups. The bimodal distribution could indicate two distinct subgroups within the dataset, or measurement variability concentrated around these values. The sharp decline at speedup 6 implies that increasing speedup beyond 5 yields minimal additional benefit for most samples. This pattern might reflect practical limits in system performance or data characteristics that favor mid-range speedup efficiencies.