## Chart: Pythia Model Performance
### Overview
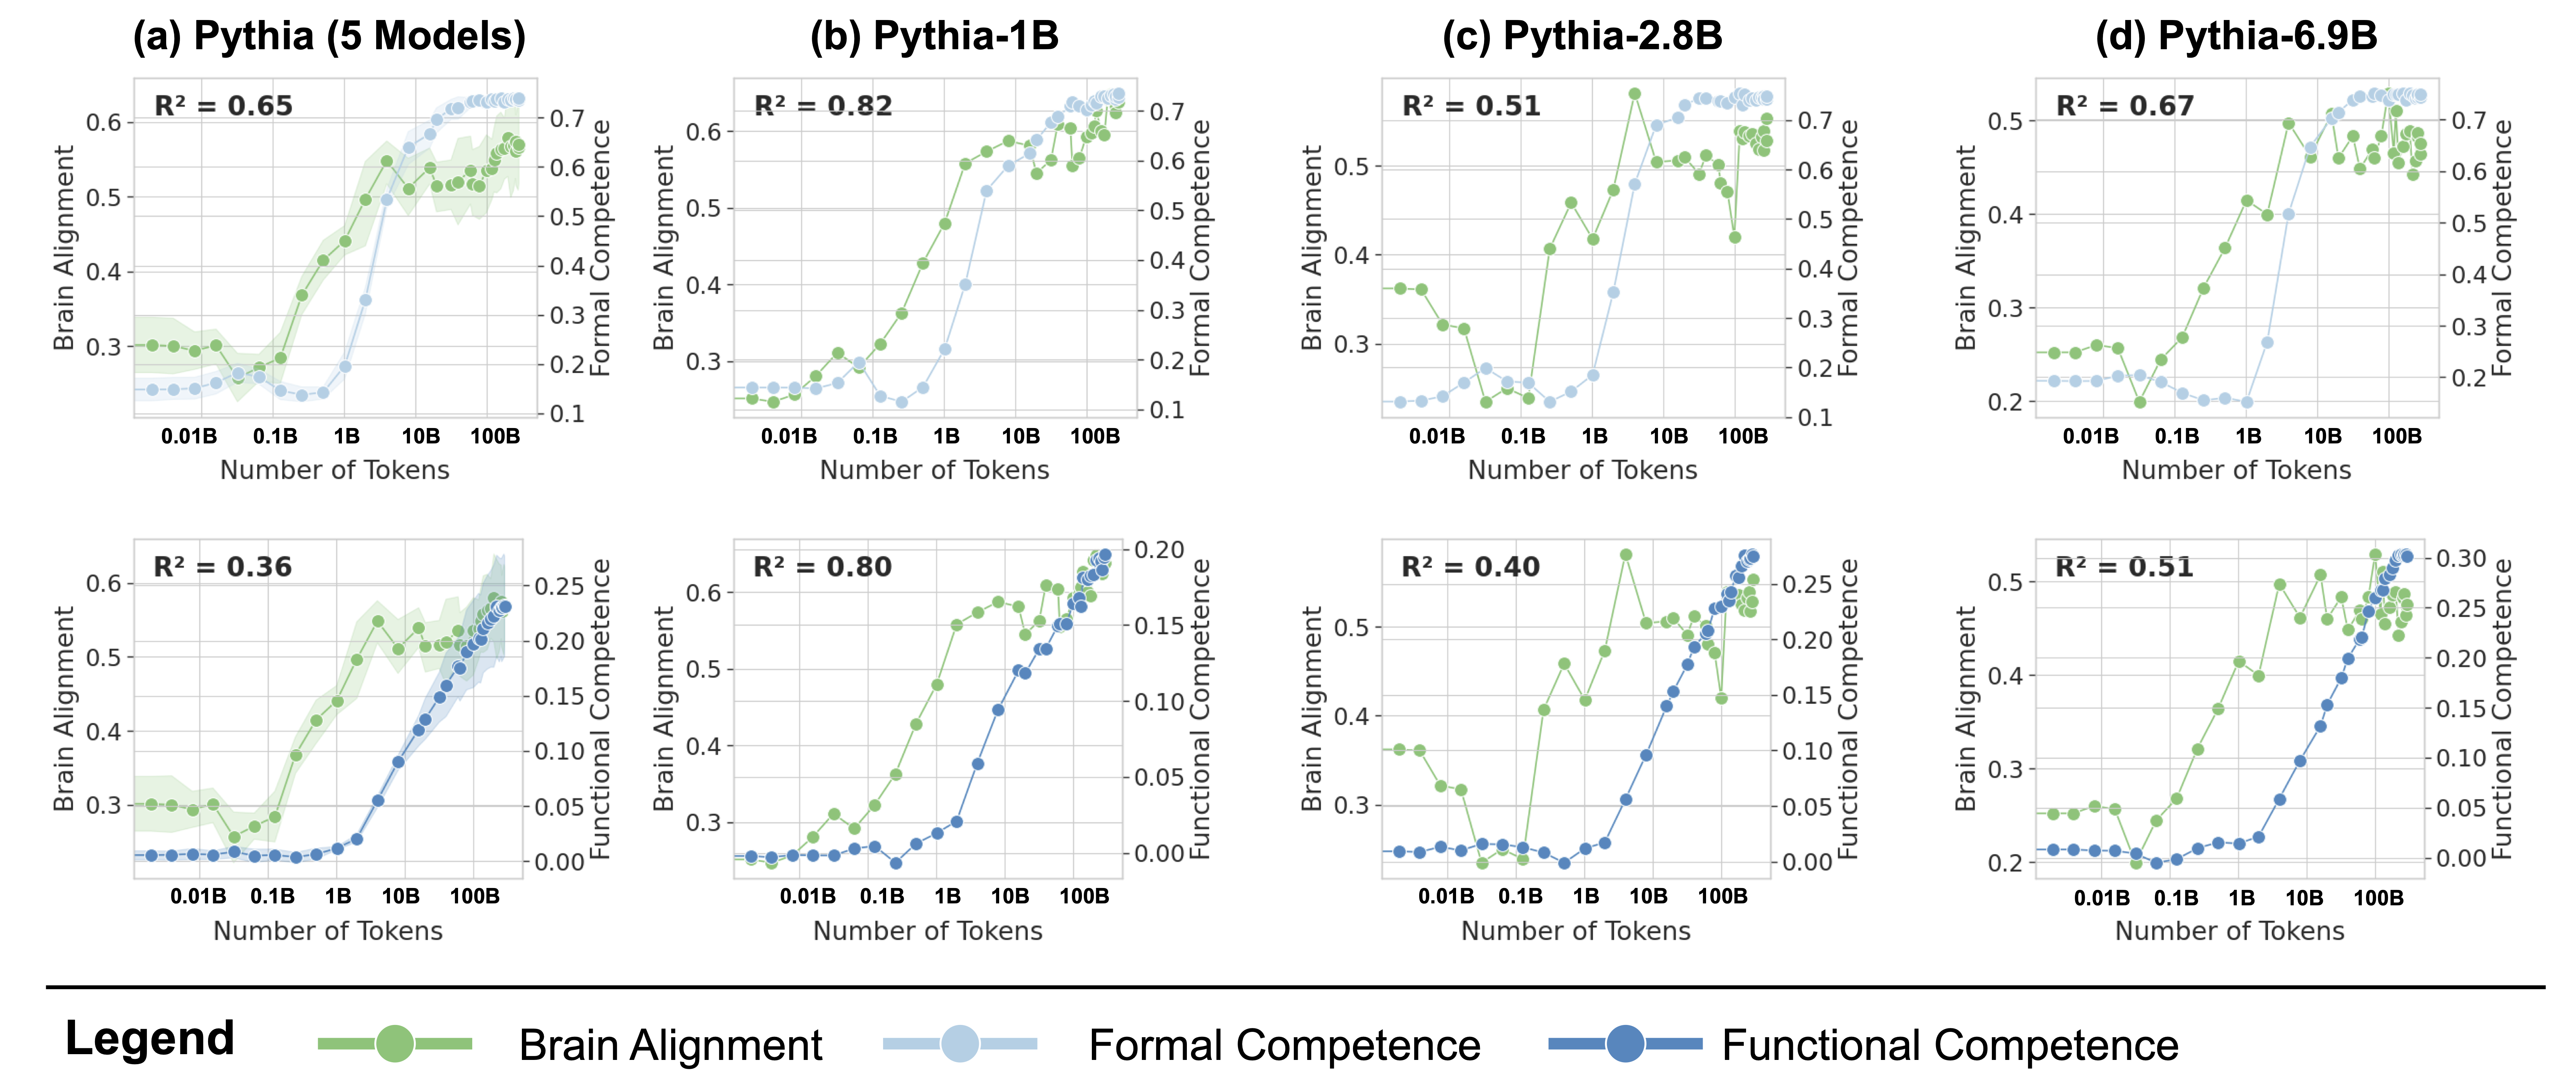
The image presents four line charts comparing the performance of different Pythia models based on "Brain Alignment," "Formal Competence," and "Functional Competence" as the number of tokens increases. Each chart corresponds to a different Pythia model or model configuration: (a) Pythia (5 Models), (b) Pythia-1B, (c) Pythia-2.8B, and (d) Pythia-6.9B. Each chart displays three data series: Brain Alignment (green), Formal Competence (light blue), and Functional Competence (dark blue). The x-axis represents the number of tokens, and the y-axes represent the Brain Alignment (left) and Formal/Functional Competence (right).
### Components/Axes
* **Titles:**
* (a) Pythia (5 Models)
* (b) Pythia-1B
* (c) Pythia-2.8B
* (d) Pythia-6.9B
* **X-axis:** Number of Tokens, with markers at 0.01B, 0.1B, 1B, 10B, and 100B.
* **Left Y-axis:** Brain Alignment, ranging from 0.2 to 0.6 (or 0.3 to 0.6 in some charts).
* **Right Y-axis:** Formal Competence (light blue) ranging from 0.1 to 0.7, and Functional Competence (dark blue) ranging from 0.0 to 0.3.
* **R² values:** Each chart displays an R² value in the top-left corner.
* (a) R² = 0.65
* (b) R² = 0.82
* (c) R² = 0.51
* (d) R² = 0.67
* (e) R² = 0.36
* (f) R² = 0.80
* (g) R² = 0.40
* (h) R² = 0.51
* **Legend:** Located at the bottom of the image.
* Green: Brain Alignment
* Light Blue: Formal Competence
* Dark Blue: Functional Competence
### Detailed Analysis
**Chart (a): Pythia (5 Models)**
* **Brain Alignment (Green):** Starts at approximately 0.3, remains relatively stable until 1B tokens, then increases to approximately 0.55 at 100B tokens.
* **Formal Competence (Light Blue):** Starts at approximately 0.2, decreases slightly, then increases sharply after 1B tokens, reaching approximately 0.7 at 100B tokens.
* **Functional Competence (Dark Blue):** Not present in this chart.
**Chart (b): Pythia-1B**
* **Brain Alignment (Green):** Starts at approximately 0.25, remains relatively stable until 1B tokens, then increases to approximately 0.6 at 100B tokens.
* **Formal Competence (Light Blue):** Starts at approximately 0.25, decreases slightly, then increases sharply after 1B tokens, reaching approximately 0.7 at 100B tokens.
* **Functional Competence (Dark Blue):** Not present in this chart.
**Chart (c): Pythia-2.8B**
* **Brain Alignment (Green):** Starts at approximately 0.35, fluctuates, and reaches approximately 0.55 at 100B tokens.
* **Formal Competence (Light Blue):** Starts at approximately 0.2, decreases slightly, then increases sharply after 1B tokens, reaching approximately 0.7 at 100B tokens.
* **Functional Competence (Dark Blue):** Not present in this chart.
**Chart (d): Pythia-6.9B**
* **Brain Alignment (Green):** Starts at approximately 0.25, remains relatively stable until 1B tokens, then increases to approximately 0.5 at 100B tokens.
* **Formal Competence (Light Blue):** Starts at approximately 0.2, decreases slightly, then increases sharply after 1B tokens, reaching approximately 0.7 at 100B tokens.
* **Functional Competence (Dark Blue):** Not present in this chart.
**Chart (e): Pythia (5 Models)**
* **Brain Alignment (Green):** Starts at approximately 0.3, remains relatively stable until 1B tokens, then increases to approximately 0.55 at 100B tokens.
* **Formal Competence (Light Blue):** Not present in this chart.
* **Functional Competence (Dark Blue):** Starts at approximately 0.02, increases sharply after 1B tokens, reaching approximately 0.25 at 100B tokens.
**Chart (f): Pythia-1B**
* **Brain Alignment (Green):** Starts at approximately 0.25, remains relatively stable until 1B tokens, then increases to approximately 0.6 at 100B tokens.
* **Formal Competence (Light Blue):** Not present in this chart.
* **Functional Competence (Dark Blue):** Starts at approximately 0.01, increases sharply after 1B tokens, reaching approximately 0.2 at 100B tokens.
**Chart (g): Pythia-2.8B**
* **Brain Alignment (Green):** Starts at approximately 0.35, fluctuates, and reaches approximately 0.55 at 100B tokens.
* **Formal Competence (Light Blue):** Not present in this chart.
* **Functional Competence (Dark Blue):** Starts at approximately 0.01, increases sharply after 1B tokens, reaching approximately 0.25 at 100B tokens.
**Chart (h): Pythia-6.9B**
* **Brain Alignment (Green):** Starts at approximately 0.2, remains relatively stable until 1B tokens, then increases to approximately 0.5 at 100B tokens.
* **Formal Competence (Light Blue):** Not present in this chart.
* **Functional Competence (Dark Blue):** Starts at approximately 0.01, increases sharply after 1B tokens, reaching approximately 0.3 at 100B tokens.
### Key Observations
* Brain Alignment (green) generally increases with the number of tokens, especially after 1B tokens.
* Formal Competence (light blue) also increases sharply after 1B tokens in the top row of charts.
* Functional Competence (dark blue) increases sharply after 1B tokens in the bottom row of charts.
* The R² values vary across the different models, indicating different levels of fit for the data.
### Interpretation
The charts suggest that as Pythia models are trained with more tokens, their brain alignment, formal competence, and functional competence generally improve. The sharp increase in competence after 1B tokens indicates a critical threshold in the training process. The different R² values suggest that the relationship between the number of tokens and the performance metrics varies across different model configurations. The data demonstrates the impact of training data size on the performance of language models. The absence of Formal Competence and Functional Competence in the top and bottom rows respectively suggests that these metrics are being measured independently or are relevant to different aspects of the model's performance.