\n
## Chart: Alignment and Competence vs. Number of Tokens for Pythia Models
### Overview
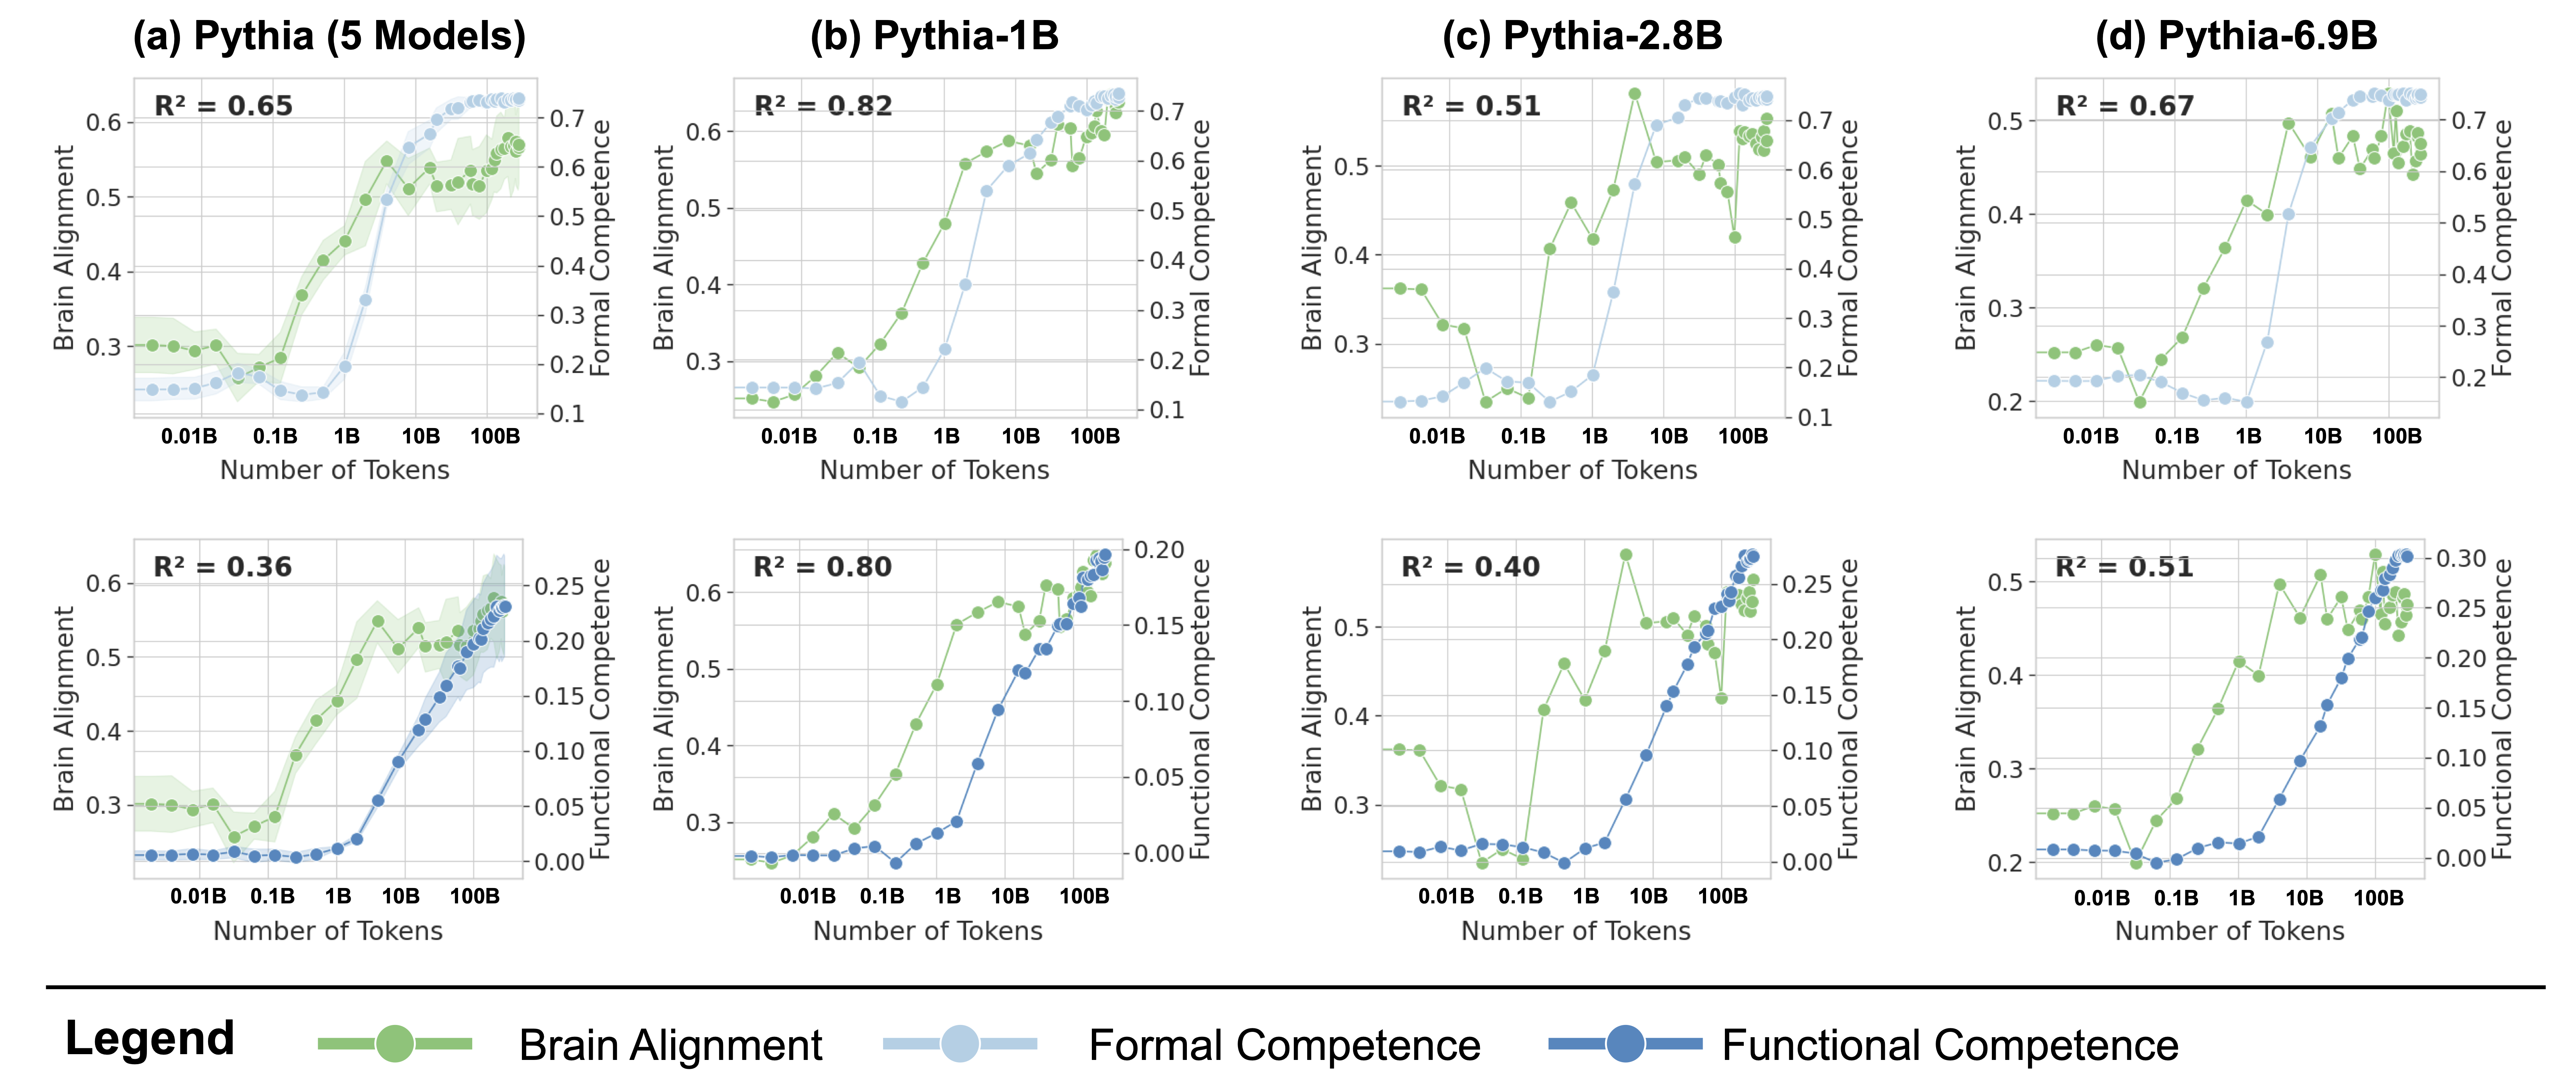
This image presents a series of six line charts comparing Brain Alignment, Formal Competence, and Functional Competence across different Pythia language models (Pythia-5 Models, Pythia-1B, Pythia-2.8B, and Pythia-6.9B) as a function of the number of tokens generated. Each chart displays two y-axes (left for Alignment, right for Competence) and an x-axis representing the number of tokens, ranging from 0.01B to 100B. R-squared values are provided for each chart.
### Components/Axes
* **X-axis (all charts):** Number of Tokens (scale: 0.01B, 1B, 10B, 100B).
* **Y-axis (left, all charts):** Brain Alignment (scale: 0.2 to 0.6).
* **Y-axis (right, all charts):** Formal Competence / Functional Competence (scales vary between charts, ranging from approximately 0.1 to 0.7 for Formal Competence and 0.0 to 0.25 for Functional Competence).
* **Charts:** Arranged in a 2x4 grid.
* (a) Pythia (5 Models)
* (b) Pythia-1B
* (c) Pythia-2.8B
* (d) Pythia-6.9B
* (e) Pythia (5 Models) - Functional Competence
* (f) Pythia-1B - Functional Competence
* (g) Pythia-2.8B - Functional Competence
* (h) Pythia-6.9B - Functional Competence
* **Legend (bottom-left):**
* Brain Alignment (Blue Line)
* Formal Competence (Green Line)
* Functional Competence (Orange Line)
* **R-squared values:** Displayed in the top-left corner of each chart.
### Detailed Analysis or Content Details
**Chart (a) Pythia (5 Models) - Brain Alignment & Formal Competence**
* R² = 0.65
* Brain Alignment (Blue): Starts at approximately 0.32, increases rapidly to a peak of around 0.58 at 10B tokens, then plateaus and slightly declines.
* Formal Competence (Green): Starts at approximately 0.35, increases steadily to around 0.65 at 100B tokens.
**Chart (b) Pythia-1B - Brain Alignment & Formal Competence**
* R² = 0.82
* Brain Alignment (Blue): Starts at approximately 0.30, increases rapidly to a peak of around 0.60 at 1B tokens, then declines to approximately 0.45 at 100B tokens.
* Formal Competence (Green): Starts at approximately 0.30, increases steadily to around 0.70 at 100B tokens.
**Chart (c) Pythia-2.8B - Brain Alignment & Formal Competence**
* R² = 0.51
* Brain Alignment (Blue): Starts at approximately 0.35, increases to a peak of around 0.55 at 1B tokens, then fluctuates around 0.50.
* Formal Competence (Green): Starts at approximately 0.40, increases steadily to around 0.65 at 100B tokens.
**Chart (d) Pythia-6.9B - Brain Alignment & Formal Competence**
* R² = 0.67
* Brain Alignment (Blue): Starts at approximately 0.35, increases to a peak of around 0.60 at 1B tokens, then fluctuates around 0.50.
* Formal Competence (Green): Starts at approximately 0.25, increases steadily to around 0.70 at 100B tokens.
**Chart (e) Pythia (5 Models) - Brain Alignment & Functional Competence**
* R² = 0.36
* Brain Alignment (Blue): Similar trend to (a), starting at approximately 0.32, peaking around 0.58 at 10B tokens, then plateauing.
* Functional Competence (Orange): Starts at approximately 0.05, increases steadily to around 0.20 at 100B tokens.
**Chart (f) Pythia-1B - Brain Alignment & Functional Competence**
* R² = 0.80
* Brain Alignment (Blue): Similar trend to (b), starting at approximately 0.30, peaking around 0.60 at 1B tokens, then declining.
* Functional Competence (Orange): Starts at approximately 0.05, increases steadily to around 0.25 at 100B tokens.
**Chart (g) Pythia-2.8B - Brain Alignment & Functional Competence**
* R² = 0.40
* Brain Alignment (Blue): Similar trend to (c), starting at approximately 0.35, peaking around 0.55 at 1B tokens, then fluctuating.
* Functional Competence (Orange): Starts at approximately 0.05, increases steadily to around 0.20 at 100B tokens.
**Chart (h) Pythia-6.9B - Brain Alignment & Functional Competence**
* R² = 0.51
* Brain Alignment (Blue): Similar trend to (d), starting at approximately 0.35, peaking around 0.60 at 1B tokens, then fluctuating.
* Functional Competence (Orange): Starts at approximately 0.05, increases steadily to around 0.25 at 100B tokens.
### Key Observations
* Brain Alignment generally peaks around 1B to 10B tokens for all models, then plateaus or slightly declines.
* Formal Competence consistently increases with the number of tokens for all models.
* Functional Competence also increases with the number of tokens, but at a slower rate and to a lower overall value than Formal Competence.
* Pythia-1B shows a strong correlation (R² = 0.82 and 0.80) between the number of tokens and both Brain Alignment and Formal Competence.
* The R-squared values for Functional Competence are generally lower than those for Brain Alignment and Formal Competence, indicating a weaker relationship.
### Interpretation
The charts demonstrate how different aspects of language model performance (Brain Alignment, Formal Competence, and Functional Competence) evolve as the model generates more tokens. The initial rapid increase in Brain Alignment suggests that the model quickly learns to align with human cognitive patterns. The consistent increase in Formal Competence indicates that the model's ability to follow grammatical rules and logical structures improves with more generated text. The slower growth of Functional Competence suggests that achieving practical, real-world usefulness is more challenging than simply mastering formal language skills.
The differences between the models (Pythia-5 Models, Pythia-1B, Pythia-2.8B, and Pythia-6.9B) highlight the impact of model size on these metrics. Larger models (e.g., Pythia-6.9B) generally exhibit higher levels of Formal Competence, but the relationship between model size and Brain Alignment/Functional Competence is less clear. The relatively high R-squared values for Pythia-1B suggest that this model may be particularly sensitive to the number of tokens generated, potentially indicating a more efficient learning process within its size constraints. The lower R-squared values for Functional Competence across all models suggest that this metric is influenced by factors beyond simply the number of tokens generated, such as the quality of the training data and the specific tasks the model is evaluated on.