## Line Graphs: Brain Alignment vs. Formal Competence Across Pythia Model Sizes
### Overview
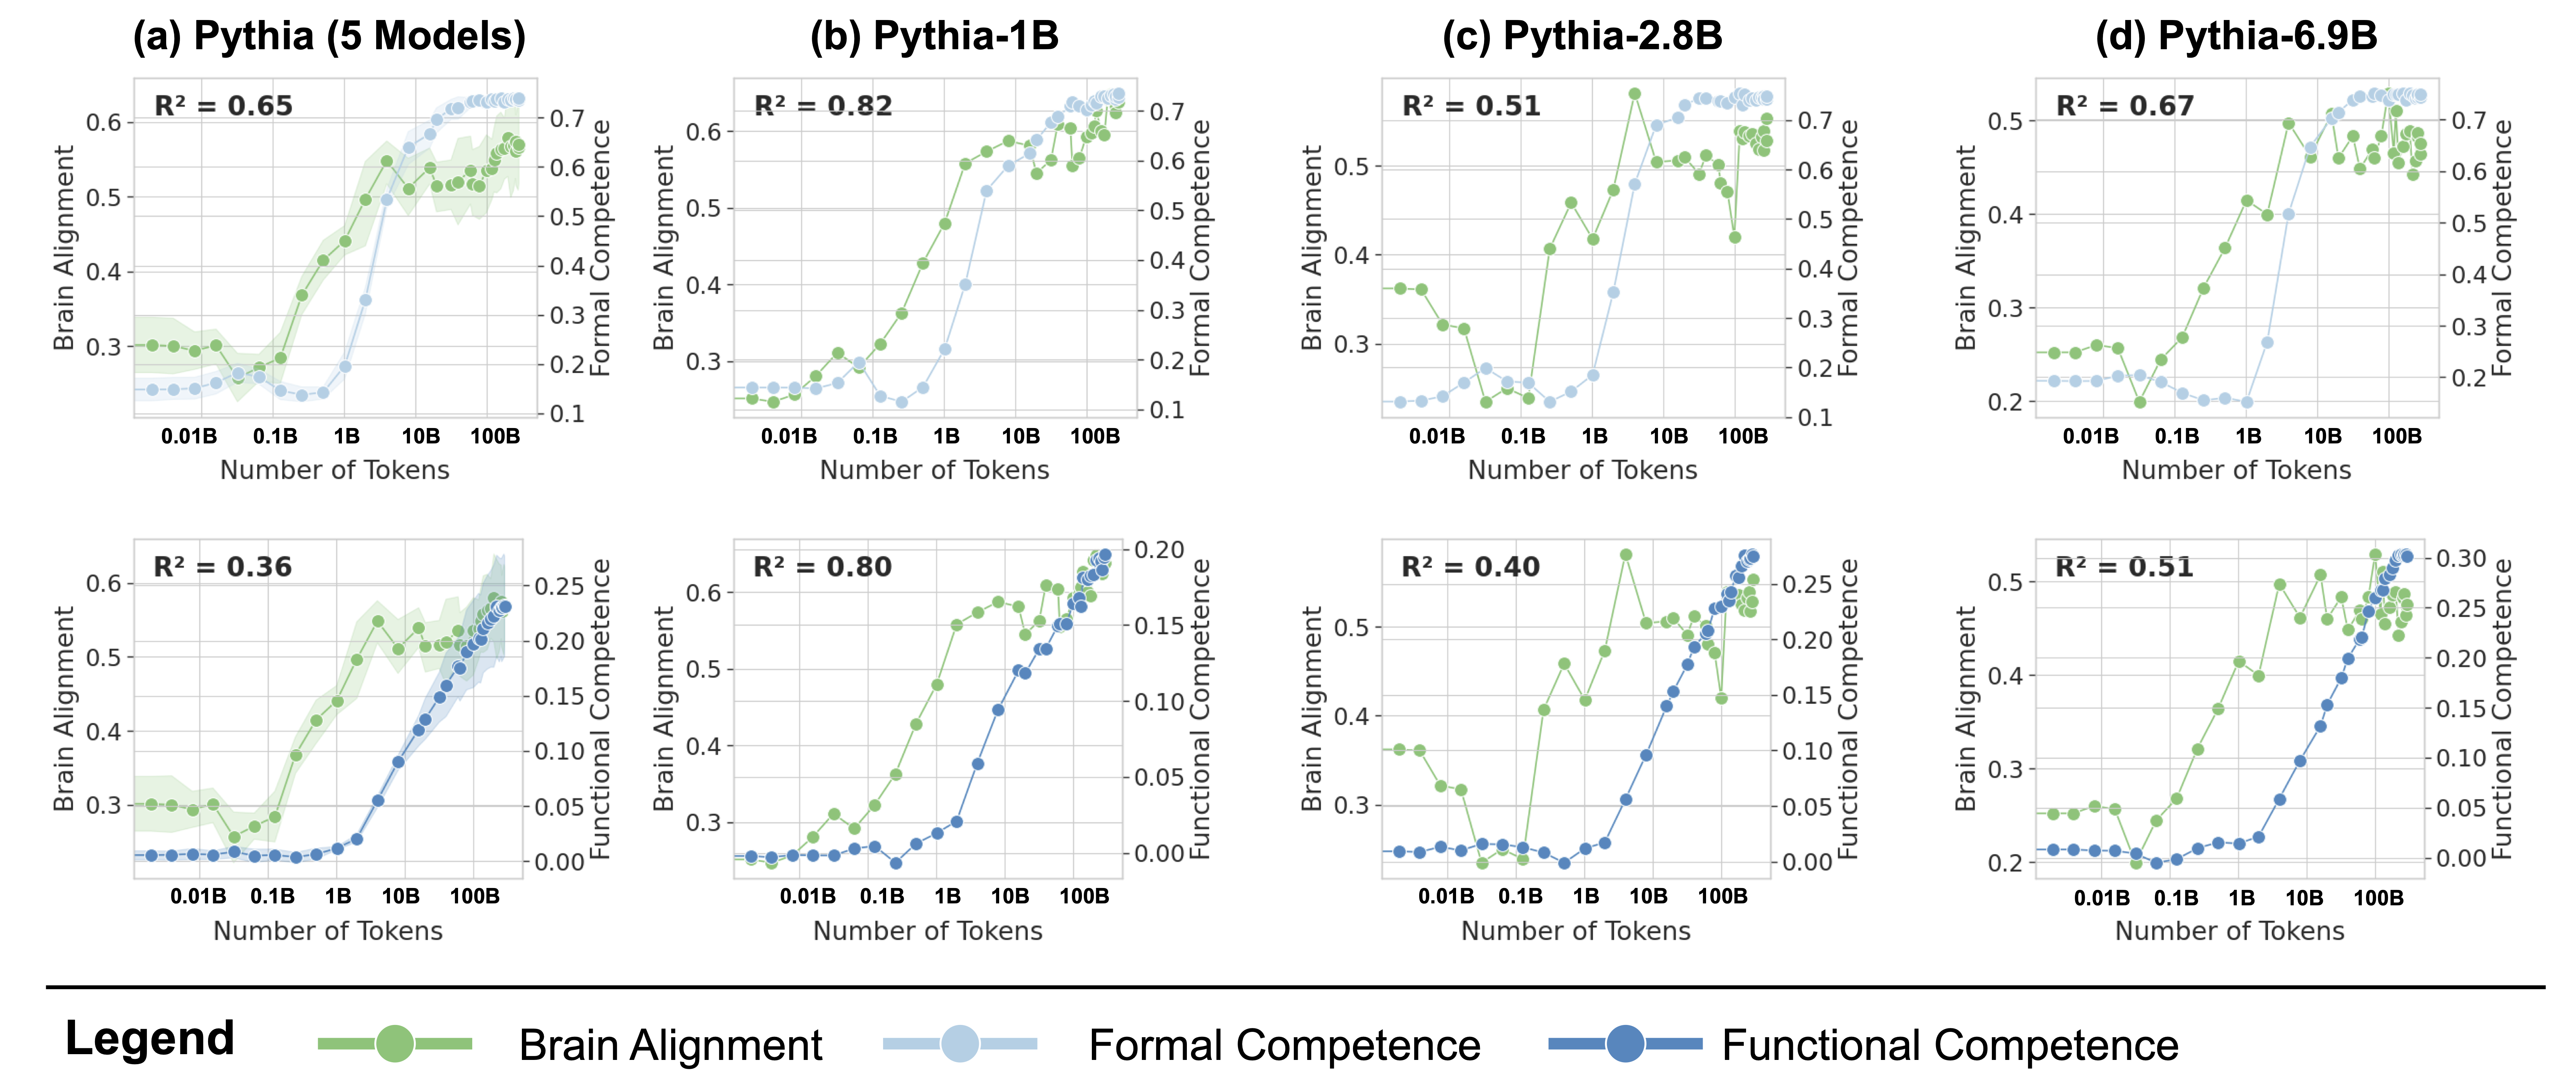
The image contains eight line graphs comparing brain alignment and formal competence metrics across different Pythia model sizes (5 Models, 1B, 2.8B, 6.9B). Each graph plots brain alignment (green) and formal competence (blue) against token count (x-axis), with functional competence (dark blue) as a secondary metric. R² values quantify the correlation between brain alignment and formal competence for each model.
### Components/Axes
- **X-axis**: Number of Tokens (logarithmic scale: 0.01B to 100B)
- **Y-axis (Left)**: Brain Alignment (0.2–0.7)
- **Y-axis (Right)**: Formal Competence (0.0–0.7)
- **Legend**:
- Green: Brain Alignment
- Blue: Formal Competence
- Dark Blue: Functional Competence
- **R² Values**:
- (a) 0.65, (b) 0.82, (c) 0.51, (d) 0.67
- (e) 0.36, (f) 0.80, (g) 0.40, (h) 0.51
### Detailed Analysis
#### Top Row (Formal Competence Metrics)
1. **(a) Pythia (5 Models)**
- Brain alignment (green) rises steeply from ~0.3 to 0.65 as tokens increase.
- Formal competence (blue) shows moderate growth (0.2–0.5).
- R² = 0.65: Strong positive correlation.
2. **(b) Pythia-1B**
- Brain alignment peaks at ~0.65, then plateaus.
- Formal competence (blue) increases sharply after 10B tokens.
- R² = 0.82: Very strong correlation.
3. **(c) Pythia-2.8B**
- Brain alignment fluctuates (0.3–0.5) with a peak at 10B tokens.
- Formal competence (blue) rises slowly (0.1–0.3).
- R² = 0.51: Moderate correlation.
4. **(d) Pythia-6.9B**
- Brain alignment (green) dominates, reaching 0.7 at 100B tokens.
- Formal competence (blue) lags, peaking at ~0.5.
- R² = 0.67: Strong correlation.
#### Bottom Row (Functional Competence Metrics)
5. **(e) Pythia (5 Models)**
- Brain alignment (green) grows steadily (0.3–0.6).
- Functional competence (dark blue) lags, peaking at ~0.25.
- R² = 0.36: Weak correlation.
6. **(f) Pythia-1B**
- Brain alignment (green) rises sharply (0.3–0.6).
- Functional competence (dark blue) increases modestly (0.05–0.2).
- R² = 0.80: Strong correlation.
7. **(g) Pythia-2.8B**
- Brain alignment (green) peaks at 10B tokens (~0.5).
- Functional competence (dark blue) remains low (<0.15).
- R² = 0.40: Weak correlation.
8. **(h) Pythia-6.9B**
- Brain alignment (green) dominates (0.3–0.6).
- Functional competence (dark blue) shows minimal growth (0.05–0.2).
- R² = 0.51: Moderate correlation.
### Key Observations
- **Model Size Impact**: Larger models (1B, 6.9B) show stronger brain alignment but weaker functional competence correlations (R² < 0.5).
- **Token Thresholds**: Significant brain alignment growth occurs after 10B tokens in most models.
- **Anomalies**:
- 2.8B model (c, g) exhibits lower R² values despite higher token counts, suggesting inefficiency.
- Functional competence (dark blue) consistently lags behind brain alignment across all models.
### Interpretation
The data suggests that larger Pythia models achieve higher brain alignment but struggle to translate this into formal competence, particularly in functional tasks. The 1B model (b, f) demonstrates the strongest overall correlation (R² = 0.82), indicating optimal balance between alignment and competence. The 2.8B model’s lower R² values (0.51, 0.40) may reflect architectural limitations or training data mismatches. Functional competence metrics (dark blue) consistently underperform, highlighting a potential gap between neural alignment and practical utility. These trends align with prior research on model scaling laws, where increased size improves specific metrics but not holistic performance.