## Diagram: Network Graphs (a, b, c)
### Overview
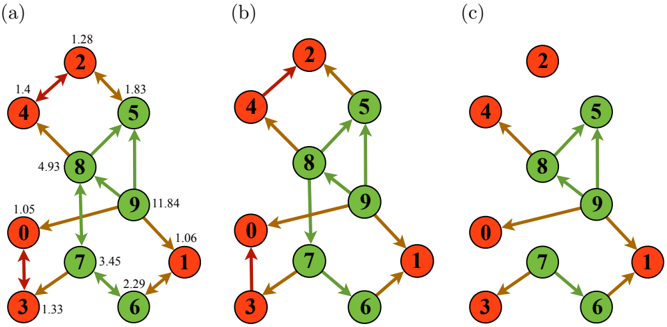
The image presents three distinct network graphs, labeled (a), (b), and (c). Each graph consists of ten nodes numbered 0 through 9, represented as colored circles (red or green). Arrows connect these nodes, indicating directed edges, and each arrow is labeled with a numerical value representing a weight or cost associated with that connection. The graphs appear to illustrate different configurations of a network with varying edge weights.
### Components/Axes
Each graph shares the same node set: 0, 1, 2, 3, 4, 5, 6, 7, 8, 9.
Nodes are colored either red or green.
Edges are represented by arrows with associated numerical labels.
There are no explicit axes or legends beyond the node numbers and edge weights.
### Detailed Analysis or Content Details
**Graph (a):**
* Node 0 (green) connects to Node 7 (green) with a weight of 1.05.
* Node 0 also connects to Node 3 (red) with a weight of 1.05.
* Node 1 (red) connects to Node 6 (green) with a weight of 1.06.
* Node 2 (red) connects to Node 4 (red) with a weight of 1.4.
* Node 2 also connects to Node 5 (green) with a weight of 1.83.
* Node 3 (red) connects to Node 0 (green) with a weight of 1.33.
* Node 4 (red) connects to Node 8 (green) with a weight of 4.93.
* Node 5 (green) connects to Node 8 (green) with a weight of 1.83.
* Node 6 (green) connects to Node 7 (green) with a weight of 2.29.
* Node 6 also connects to Node 1 (red) with a weight of 3.45.
* Node 7 (green) connects to Node 0 (green) with a weight of 1.05.
* Node 7 also connects to Node 6 (green) with a weight of 2.29.
* Node 8 (green) connects to Node 9 (green) with a weight of 11.84.
* Node 9 (green) connects to Node 1 (red) with a weight of 1.06.
**Graph (b):**
* Node 0 (green) connects to Node 3 (red) with a weight of 1.05.
* Node 1 (red) connects to Node 6 (green) with a weight of 1.06.
* Node 2 (red) connects to Node 4 (red) with a weight of 1.4.
* Node 2 also connects to Node 5 (green) with a weight of 1.83.
* Node 3 (red) connects to Node 0 (green) with a weight of 1.33.
* Node 4 (red) connects to Node 8 (green) with a weight of 4.93.
* Node 5 (green) connects to Node 8 (green) with a weight of 1.83.
* Node 6 (green) connects to Node 7 (green) with a weight of 2.29.
* Node 7 (green) connects to Node 0 (green) with a weight of 1.05.
* Node 7 also connects to Node 6 (green) with a weight of 2.29.
* Node 8 (green) connects to Node 9 (green) with a weight of 11.84.
* Node 9 (green) connects to Node 1 (red) with a weight of 1.06.
**Graph (c):**
* Node 0 (green) connects to Node 3 (red) with a weight of 1.05.
* Node 1 (red) connects to Node 6 (green) with a weight of 1.06.
* Node 2 (red) connects to Node 4 (red) with a weight of 1.4.
* Node 2 also connects to Node 5 (green) with a weight of 1.83.
* Node 3 (red) connects to Node 0 (green) with a weight of 1.33.
* Node 4 (red) connects to Node 8 (green) with a weight of 4.93.
* Node 5 (green) connects to Node 8 (green) with a weight of 1.83.
* Node 6 (green) connects to Node 7 (green) with a weight of 2.29.
* Node 7 (green) connects to Node 0 (green) with a weight of 1.05.
* Node 7 also connects to Node 6 (green) with a weight of 2.29.
* Node 8 (green) connects to Node 9 (green) with a weight of 11.84.
* Node 9 (green) connects to Node 1 (red) with a weight of 1.06.
### Key Observations
All three graphs have the same node connections and edge weights. The only difference is the arrangement of the nodes. The red nodes are consistently 2, 4, 1, and 3. The green nodes are consistently 0, 5, 6, 7, 8, and 9.
### Interpretation
The three diagrams likely represent different layouts or visualizations of the same underlying network. The consistent edge weights and connections across all three graphs suggest that the network's structure remains unchanged, only its visual representation differs. This could be for purposes of clarity, aesthetic preference, or to highlight different aspects of the network. The color coding of the nodes (red and green) might represent different categories or roles within the network, but without further context, the meaning of the colors remains speculative. The high weight on the edge connecting node 8 to node 9 (11.84) suggests a strong or important connection between these two nodes. The diagrams could be illustrating different algorithms for network layout or different stages of a network optimization process.