## Network Diagram: Directed Graph Evolution
### Overview
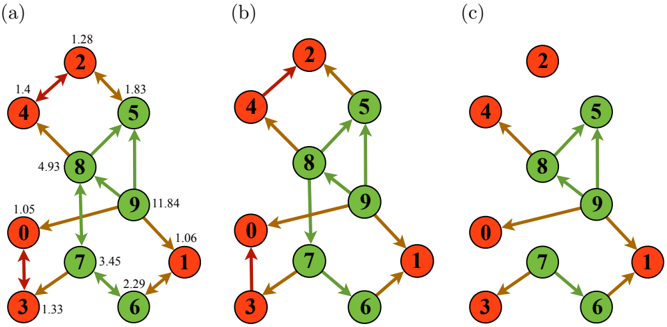
The image displays three directed network diagrams, labeled (a), (b), and (c), arranged horizontally from left to right. Each diagram consists of numbered nodes (0 through 9) connected by directed arrows. The nodes are colored either red or green. Diagram (a) includes numerical values on the edges, while diagrams (b) and (c) do not. The sequence appears to show a progression or filtering of connections from (a) to (c).
### Components/Axes
* **Node Labels:** Each node is a circle containing a single digit: 0, 1, 2, 3, 4, 5, 6, 7, 8, 9.
* **Node Colors:**
* **Red Nodes:** 0, 1, 2, 3, 4.
* **Green Nodes:** 5, 6, 7, 8, 9.
* **Edge Labels (Diagram a only):** Numerical values are placed adjacent to many of the directed arrows (edges). These values are: 1.28, 1.4, 1.83, 4.93, 11.84, 1.05, 1.06, 3.45, 2.29, 1.33.
* **Spatial Layout:** The nodes are arranged in a roughly hexagonal or circular pattern.
* Node 2 is at the top center.
* Nodes 4 and 5 are in the upper left and right, respectively.
* Nodes 8 and 9 are in the center.
* Nodes 0 and 1 are at the bottom left and right, respectively.
* Nodes 3, 6, and 7 form a lower cluster.
### Detailed Analysis
**Diagram (a): Weighted Directed Network**
* **Node & Edge Inventory with Weights:**
* **Node 2 (Red):** Receives an edge from Node 4 (weight: 1.4). Sends an edge to Node 5 (weight: 1.28).
* **Node 4 (Red):** Sends an edge to Node 2 (weight: 1.4). Receives an edge from Node 8 (weight: 4.93).
* **Node 5 (Green):** Receives an edge from Node 2 (weight: 1.28). Sends an edge to Node 8 (weight: 1.83). Receives an edge from Node 9.
* **Node 8 (Green):** Sends an edge to Node 4 (weight: 4.93). Receives an edge from Node 5 (weight: 1.83). Sends an edge to Node 9. Receives an edge from Node 7.
* **Node 9 (Green):** Sends an edge to Node 5. Receives an edge from Node 8. Sends an edge to Node 0 (weight: 11.84). Sends an edge to Node 1 (weight: 1.06). Receives an edge from Node 7.
* **Node 0 (Red):** Receives an edge from Node 9 (weight: 11.84). Sends a bidirectional edge to Node 3 (weight: 1.05 on the 0→3 arrow).
* **Node 1 (Red):** Receives an edge from Node 9 (weight: 1.06). Sends an edge to Node 6.
* **Node 3 (Red):** Engaged in a bidirectional edge with Node 0 (weight: 1.33 on the 3→0 arrow). Sends an edge to Node 7.
* **Node 6 (Green):** Receives an edge from Node 1. Sends an edge to Node 7 (weight: 2.29). Sends an edge to Node 1.
* **Node 7 (Green):** Receives an edge from Node 3. Sends an edge to Node 8. Receives an edge from Node 6 (weight: 2.29). Sends an edge to Node 9 (weight: 3.45).
**Diagram (b): Unweighted Directed Network**
* This diagram preserves the exact same node positions and edge directions as diagram (a).
* **Key Difference:** All numerical edge weights have been removed. The structure is identical, showing only the connectivity.
**Diagram (c): Pruned Directed Network**
* This diagram maintains the same node positions and colors.
* **Key Difference:** Several edges present in (a) and (b) have been removed. The remaining edges are:
* 4 → 2
* 2 → 5
* 5 → 8
* 8 → 9
* 9 → 5
* 9 → 0
* 9 → 1
* 0 → 3 (bidirectional arrow remains)
* 3 → 0 (bidirectional arrow remains)
* 3 → 7
* 7 → 8
* 6 → 7
* 7 → 9
* 6 → 1
* **Edges Removed from (b) to (c):**
* 4 → 8
* 8 → 4
* 1 → 6
* The bidirectional connection between 0 and 3 is retained, but the specific weight labels are gone.
### Key Observations
1. **Color-Coded Groups:** The network is clearly partitioned into two color-coded groups: Red (0,1,2,3,4) and Green (5,6,7,8,9).
2. **Central Hub:** Node 9 (Green) acts as a major hub in diagrams (a) and (b), with the highest out-degree (sending edges to 0, 1, 5) and a very high-weight edge to Node 0 (11.84).
3. **Strongest Connection:** The edge from Node 9 to Node 0 has the highest weight (11.84) in diagram (a), suggesting a particularly strong or significant relationship.
4. **Structural Evolution:** The progression from (a) to (c) shows a reduction in network complexity. Diagram (c) appears to be a filtered or core subgraph of (b), retaining only certain connections, possibly based on a weight threshold or structural importance.
5. **Bidirectional Link:** The connection between Node 0 and Node 3 is the only explicitly bidirectional edge, indicated by a double-headed arrow in all diagrams.
### Interpretation
These diagrams likely represent the evolution or analysis of a directed network, such as a social network, information flow, or system component interaction.
* **Diagram (a)** provides the full quantitative picture, where edge weights could represent strength, frequency, capacity, or probability of interaction. The high weight between 9 and 0 is a critical feature.
* **Diagram (b)** abstracts away the quantitative detail to focus purely on the topological structure—who is connected to whom.
* **Diagram (c)** suggests a process of **network pruning or backbone extraction**. The removal of specific edges implies they were deemed less significant, possibly because their weights were below a certain threshold or because they were redundant for maintaining core connectivity. The retained structure in (c) highlights the most essential pathways, with Node 9 remaining a central connector and the Red-Green group boundary still evident but with fewer cross-group links.
The color division might indicate two distinct communities, types, or states within the system. The analysis shows how a weighted, complex network can be simplified to reveal its fundamental architecture.