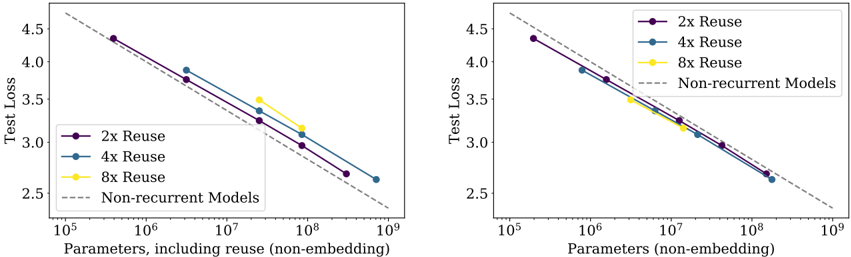
## Chart: Test Loss vs. Parameters
### Overview
The image contains two line charts comparing the test loss of different models against the number of parameters. The left chart plots "Parameters, including reuse (non-embedding)" on the x-axis, while the right chart plots "Parameters (non-embedding)". Both charts show the test loss on the y-axis. The charts compare models with different reuse factors (2x, 4x, and 8x) and a baseline of non-recurrent models.
### Components/Axes
**Left Chart:**
* **X-axis:** Parameters, including reuse (non-embedding). Logarithmic scale from 10^5 to 10^9.
* **Y-axis:** Test Loss. Linear scale from 2.5 to 4.5.
* **Legend:** Located in the top-right corner.
* Purple: 2x Reuse
* Blue: 4x Reuse
* Yellow: 8x Reuse
* Gray dashed line: Non-recurrent Models
**Right Chart:**
* **X-axis:** Parameters (non-embedding). Logarithmic scale from 10^5 to 10^9.
* **Y-axis:** Test Loss. Linear scale from 2.5 to 4.5.
* **Legend:** Located in the top-right corner.
* Purple: 2x Reuse
* Blue: 4x Reuse
* Yellow: 8x Reuse
* Gray dashed line: Non-recurrent Models
### Detailed Analysis
**Left Chart (Parameters, including reuse):**
* **2x Reuse (Purple):** The line slopes downward.
* (10^5, 4.35)
* (10^6, 3.85)
* (10^7, 3.25)
* (10^8, 2.8)
* (10^9, 2.6)
* **4x Reuse (Blue):** The line slopes downward.
* (10^6, 3.9)
* (10^7, 3.4)
* (10^8, 2.9)
* (10^9, 2.65)
* **8x Reuse (Yellow):** The line slopes downward.
* (10^7, 3.5)
* (10^8, 3.2)
* **Non-recurrent Models (Gray dashed line):** The line slopes downward.
* (10^5, 4.7)
* (10^9, 2.5)
**Right Chart (Parameters, non-embedding):**
* **2x Reuse (Purple):** The line slopes downward.
* (10^5, 4.35)
* (10^6, 3.85)
* (10^7, 3.25)
* (10^8, 2.8)
* (10^9, 2.6)
* **4x Reuse (Blue):** The line slopes downward.
* (10^5, 4.4)
* (10^6, 3.9)
* (10^7, 3.4)
* (10^8, 2.9)
* (10^9, 2.65)
* **8x Reuse (Yellow):** The line slopes downward.
* (10^5, 4.4)
* (10^6, 3.9)
* (10^7, 3.5)
* (10^8, 3.2)
* **Non-recurrent Models (Gray dashed line):** The line slopes downward.
* (10^5, 4.7)
* (10^9, 2.5)
### Key Observations
* Test loss decreases as the number of parameters increases for all models.
* The non-recurrent models consistently show the lowest test loss across the parameter range.
* The 8x Reuse model has the highest test loss for a given number of parameters, especially in the left chart.
* The difference between the models decreases as the number of parameters increases.
* The left chart includes "reuse" in the parameter count, while the right chart does not.
### Interpretation
The charts suggest that increasing the number of parameters generally improves model performance (reduces test loss). However, the reuse factor impacts the efficiency of parameter usage. The non-recurrent models, represented by the gray dashed line, consistently outperform the recurrent models with reuse, indicating that for a given number of parameters, non-recurrent models achieve lower test loss. The difference between the left and right charts highlights the impact of including the "reuse" parameters in the total parameter count. The 8x reuse model appears to be less efficient in utilizing parameters compared to the 2x and 4x reuse models. The data implies that there is a trade-off between parameter reuse and model performance, and non-recurrent models may be more efficient in this context.