## Line Charts: Scaling Laws for Recurrent Models with Parameter Reuse
### Overview
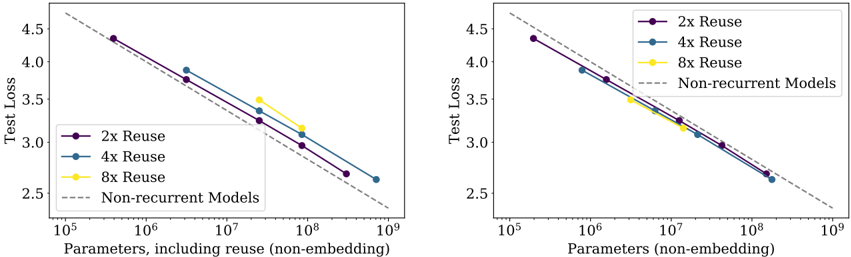
The image contains two side-by-side log-log line charts comparing the scaling behavior of recurrent models with different levels of parameter reuse against a baseline of non-recurrent models. The charts plot Test Loss against model size (parameter count), demonstrating how performance improves with scale. The key difference between the two plots is the definition of the x-axis parameter count.
### Components/Axes
**Common Elements (Both Charts):**
* **Y-Axis:** Label: `Test Loss`. Scale: Linear, ranging from 2.5 to 4.5. Major ticks at 2.5, 3.0, 3.5, 4.0, 4.5.
* **Legend:** Located in the top-right corner of each plot.
* `2x Reuse` (Purple solid line with circular markers)
* `4x Reuse` (Blue solid line with circular markers)
* `8x Reuse` (Yellow solid line with circular markers)
* `Non-recurrent Models` (Gray dashed line, no markers)
* **Data Series:** Four lines are plotted on each chart, following a clear downward trend from top-left to bottom-right.
**Left Chart Specifics:**
* **X-Axis:** Label: `Parameters, including reuse (non-embedding)`. Scale: Logarithmic, ranging from 10^5 to 10^9. Major ticks at 10^5, 10^6, 10^7, 10^8, 10^9.
* **Title/Context:** Not explicitly stated, but the axis implies this plot counts the total number of parameters used during computation, including those reused across steps.
**Right Chart Specifics:**
* **X-Axis:** Label: `Parameters (non-embedding)`. Scale: Logarithmic, ranging from 10^5 to 10^9. Major ticks at 10^5, 10^6, 10^7, 10^8, 10^9.
* **Title/Context:** Not explicitly stated, but the axis implies this plot counts only the unique parameters stored in the model, excluding the effect of reuse.
### Detailed Analysis
**Trend Verification:** All four data series in both charts exhibit a strong, consistent downward linear trend on the log-log scale. This indicates a power-law relationship: Test Loss decreases as a power of the parameter count.
**Data Point Extraction (Approximate Values):**
**Left Chart (Parameters including reuse):**
* **Non-recurrent Models (Gray Dashed):** Serves as a baseline. Starts near (10^5, 4.7) and ends near (10^9, 2.3).
* **2x Reuse (Purple):**
* Point 1: (~3 x 10^5, 4.4)
* Point 2: (~3 x 10^6, 3.75)
* Point 3: (~3 x 10^7, 3.25)
* Point 4: (~3 x 10^8, 2.7)
* **4x Reuse (Blue):**
* Point 1: (~3 x 10^6, 3.9)
* Point 2: (~3 x 10^7, 3.4)
* Point 3: (~3 x 10^8, 3.0)
* Point 4: (~10^9, 2.6)
* **8x Reuse (Yellow):**
* Point 1: (~3 x 10^7, 3.5)
* Point 2: (~10^8, 3.25)
* Point 3: (~3 x 10^8, 3.1)
**Right Chart (Unique Parameters):**
* **Non-recurrent Models (Gray Dashed):** Same baseline as the left chart.
* **2x Reuse (Purple):**
* Point 1: (~3 x 10^5, 4.4)
* Point 2: (~3 x 10^6, 3.75)
* Point 3: (~3 x 10^7, 3.25)
* Point 4: (~3 x 10^8, 2.7)
* **4x Reuse (Blue):**
* Point 1: (~10^6, 3.9)
* Point 2: (~10^7, 3.4)
* Point 3: (~10^8, 3.0)
* Point 4: (~3 x 10^8, 2.6)
* **8x Reuse (Yellow):**
* Point 1: (~10^7, 3.5)
* Point 2: (~3 x 10^7, 3.25)
* Point 3: (~10^8, 3.1)
### Key Observations
1. **Consistent Scaling Law:** All models, regardless of reuse factor, follow a power-law scaling trend similar to the non-recurrent baseline. The lines are roughly parallel.
2. **Effect of Reuse on Parameter Count:** The primary difference between the two charts is the horizontal positioning of the reuse model curves.
* In the **right chart** (unique parameters), the curves for 2x, 4x, and 8x reuse are shifted to the **left** relative to the non-recurrent line. This means for a given number of *unique* parameters, recurrent models with reuse achieve a lower test loss.
* In the **left chart** (parameters including reuse), the curves for reuse models are shifted to the **right**. This means when counting all computational parameters (including reused ones), recurrent models require more total "parameter work" to achieve the same loss as a non-recurrent model.
3. **Diminishing Returns of Higher Reuse:** The 8x Reuse (yellow) line sits above the 4x and 2x lines in both charts for a given x-axis value. This suggests that while reuse is parameter-efficient (right chart), increasing the reuse factor beyond a point may lead to a less favorable trade-off, requiring more unique parameters (or total computation) to reach the same loss level as a lower-reuse model.
### Interpretation
These charts illustrate a fundamental trade-off in recurrent neural network design: **parameter efficiency vs. computational efficiency**.
* **The Right Chart tells a story of parameter efficiency.** By reusing parameters across time steps, a recurrent model can achieve better performance (lower loss) with fewer *unique* stored parameters compared to a standard non-recurrent model. This is valuable for deployment on memory-constrained devices. The 2x reuse model is the most parameter-efficient, sitting furthest to the left.
* **The Left Chart tells a story of computational cost.** When you account for the total number of parameter operations performed during a forward pass (including all reuses), recurrent models actually perform *more* total computation than a non-recurrent model of equivalent performance. The 8x reuse model is the most computationally expensive, sitting furthest to the right.
**Conclusion:** The data demonstrates that parameter reuse in recurrent models successfully decouples the scaling of stored parameters from the scaling of computational cost. It allows for the creation of models that are compact in memory but require more computation to train and run, following the same fundamental power-law scaling behavior as larger, non-recurrent models. The choice of reuse factor (2x, 4x, 8x) represents a direct tuning knob on this efficiency trade-off.