## Line Chart: Test Loss vs. Parameters with Reuse Configurations
### Overview
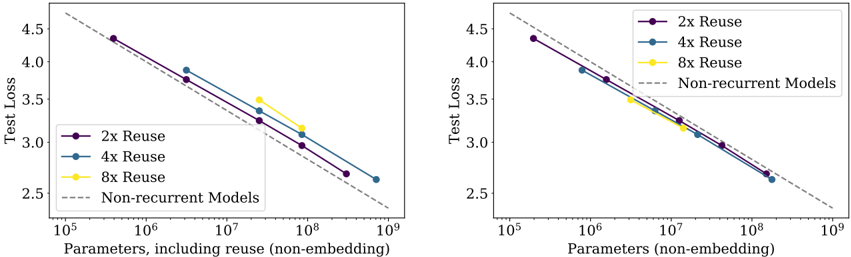
The image contains two side-by-side line charts comparing test loss across different model configurations (2x, 4x, 8x reuse) against non-recurrent models. The left chart includes parameters with reuse (non-embedding), while the right chart excludes parameters. Both charts use a logarithmic scale for parameters (x-axis) and linear scale for test loss (y-axis). Data points are plotted with distinct colors for each reuse configuration, and a dashed gray line represents non-recurrent models.
---
### Components/Axes
- **Left Chart**:
- **X-axis**: "Parameters, including reuse (non-embedding)" (log scale: 10⁵ to 10⁹)
- **Y-axis**: "Test Loss" (linear scale: 2.5 to 4.5)
- **Legend**:
- Purple circles: 2x Reuse
- Blue squares: 4x Reuse
- Yellow triangles: 8x Reuse
- Dashed gray line: Non-recurrent Models
- **Right Chart**:
- **X-axis**: "Parameters (non-embedding)" (log scale: 10⁵ to 10⁹)
- **Y-axis**: "Test Loss" (linear scale: 2.5 to 4.5)
- **Legend**: Same as left chart.
---
### Detailed Analysis
#### Left Chart (Parameters with Reuse)
- **Trends**:
- All reuse configurations (2x, 4x, 8x) show a **downward trend** in test loss as parameters increase.
- The 8x Reuse (yellow) consistently has the **lowest test loss**, followed by 4x (blue) and 2x (purple).
- Non-recurrent models (dashed gray) maintain a **flat, high test loss** (~4.0–4.5) across all parameter ranges.
- **Data Points**:
- At 10⁵ parameters:
- 2x Reuse: ~4.3
- 4x Reuse: ~4.1
- 8x Reuse: ~3.9
- At 10⁹ parameters:
- 2x Reuse: ~2.7
- 4x Reuse: ~2.6
- 8x Reuse: ~2.5
#### Right Chart (Parameters without Reuse)
- **Trends**:
- Reuse configurations (2x, 4x, 8x) **converge** toward the non-recurrent line as parameters increase.
- At lower parameters (10⁵–10⁷), reuse models outperform non-recurrent models significantly.
- At higher parameters (10⁸–10⁹), performance gaps narrow, with 8x Reuse still slightly better.
- **Data Points**:
- At 10⁵ parameters:
- 2x Reuse: ~4.4
- 4x Reuse: ~4.2
- 8x Reuse: ~4.0
- At 10⁹ parameters:
- 2x Reuse: ~2.8
- 4x Reuse: ~2.7
- 8x Reuse: ~2.6
---
### Key Observations
1. **Reuse Improves Efficiency**: Models with reuse (2x, 4x, 8x) consistently achieve lower test loss than non-recurrent models, especially at smaller parameter scales.
2. **Diminishing Returns**: The gap between reuse configurations and non-recurrent models narrows as parameters increase, suggesting diminishing benefits of reuse at scale.
3. **Parameter Impact**: Including parameters (left chart) shows steeper performance improvements with reuse compared to excluding them (right chart).
4. **8x Reuse Dominance**: The 8x Reuse configuration outperforms others across all parameter ranges.
---
### Interpretation
The data demonstrates that **reuse mechanisms significantly enhance model efficiency**, reducing test loss even at smaller parameter scales. The left chart highlights that parameter count amplifies the benefits of reuse, while the right chart shows that reuse alone can achieve near-optimal performance without excessive parameter growth. This suggests that **reuse strategies are more critical than raw parameter scaling** for improving model efficiency. The convergence of reuse lines in the right chart implies that beyond a certain parameter threshold, additional parameters offer minimal gains compared to optimized reuse.