## Scatter Plot: f_coh vs f_c
### Overview
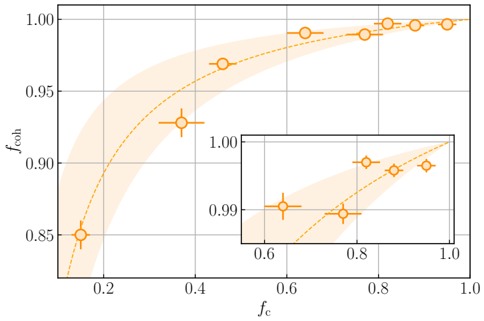
The image is a scatter plot showing the relationship between two variables, f_coh (y-axis) and f_c (x-axis). The plot includes data points with error bars, a dashed orange trend line, and a shaded region around the trend line indicating uncertainty. An inset plot provides a zoomed-in view of the data at higher values of f_c.
### Components/Axes
* **X-axis:** Labeled "f_c", with a scale from 0 to 1.0, marked at 0.2, 0.4, 0.6, 0.8, and 1.0.
* **Y-axis:** Labeled "f_coh", with a scale from 0.85 to 1.00, marked at 0.85, 0.90, 0.95, and 1.00.
* **Data Points:** Orange circles with error bars, indicating the uncertainty in the measurements.
* **Trend Line:** A dashed orange line showing the general trend of the data.
* **Uncertainty Region:** A shaded orange region around the trend line, representing the confidence interval.
* **Inset Plot:** A smaller plot in the lower-right corner, zooming in on the data points with f_c values between approximately 0.6 and 1.0. The inset plot's y-axis ranges from 0.99 to 1.00.
### Detailed Analysis
**Main Plot Data Points:**
* **Point 1:** f_c ≈ 0.15, f_coh ≈ 0.85.
* **Point 2:** f_c ≈ 0.4, f_coh ≈ 0.93.
* **Point 3:** f_c ≈ 0.65, f_coh ≈ 0.98.
* **Point 4:** f_c ≈ 0.8, f_coh ≈ 0.99.
* **Point 5:** f_c ≈ 0.9, f_coh ≈ 0.995.
* **Point 6:** f_c ≈ 1.0, f_coh ≈ 0.998.
**Inset Plot Data Points:**
* **Point 1:** f_c ≈ 0.65, f_coh ≈ 0.991.
* **Point 2:** f_c ≈ 0.8, f_coh ≈ 0.997.
* **Point 3:** f_c ≈ 0.9, f_coh ≈ 0.998.
* **Point 4:** f_c ≈ 1.0, f_coh ≈ 0.999.
**Trend Verification:**
The trend line in both the main plot and the inset plot slopes upward, indicating a positive correlation between f_c and f_coh. The rate of increase appears to diminish as f_c approaches 1.0.
### Key Observations
* There is a positive correlation between f_c and f_coh. As f_c increases, f_coh also increases.
* The rate of increase in f_coh diminishes as f_c approaches 1.0, suggesting a saturation effect.
* The inset plot provides a more detailed view of the data at higher f_c values, showing that f_coh approaches 1.0 asymptotically.
* The error bars indicate some uncertainty in the measurements, but the overall trend is clear.
### Interpretation
The data suggests that f_coh is dependent on f_c, with a positive relationship between the two variables. The saturation effect observed at higher f_c values may indicate a physical limit or a diminishing return on increasing f_c. The uncertainty region around the trend line provides a visual representation of the confidence in the relationship between f_c and f_coh. The inset plot confirms the asymptotic behavior of f_coh as f_c approaches 1.0.