## Line Chart: Relationship Between f_c and f_coh
### Overview
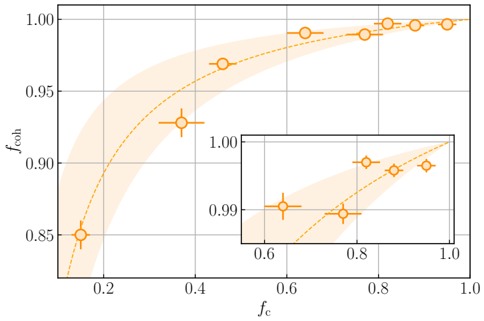
The image depicts a line chart with a shaded confidence interval and experimental data points. The chart explores the relationship between two variables: f_c (x-axis) and f_coh (y-axis). A dashed theoretical model curve is plotted alongside experimental data points with error bars, and an inset provides a zoomed-in view of the high-f_c region.
### Components/Axes
- **X-axis (f_c)**: Ranges from 0.2 to 1.0 in increments of 0.2. Labeled "f_c" with gridlines.
- **Y-axis (f_coh)**: Ranges from 0.85 to 1.00 in increments of 0.05. Labeled "f_coh" with gridlines.
- **Legend**:
- Dashed orange line: "Theoretical model"
- Shaded orange region: "Confidence interval (±1σ)"
- Orange data points with error bars: "Experimental measurements"
- **Inset**: A smaller chart inset in the bottom-right corner, focusing on f_c values from 0.6 to 1.0.
### Detailed Analysis
#### Main Chart Data Points
| f_c | f_coh | Error Bars (approx.) |
|-----|-------|----------------------|
| 0.2 | 0.85 | ±0.02 |
| 0.4 | 0.92 | ±0.03 |
| 0.6 | 0.95 | ±0.02 |
| 0.8 | 0.98 | ±0.01 |
| 1.0 | 1.00 | ±0.01 |
#### Inset Chart Data Points
| f_c | f_coh | Error Bars (approx.) |
|-----|-------|----------------------|
| 0.6 | 0.95 | ±0.02 |
| 0.8 | 0.98 | ±0.01 |
| 1.0 | 1.00 | ±0.01 |
#### Theoretical Model Curve
- The dashed orange line follows a sigmoidal trend, starting at (0.2, 0.85) and asymptotically approaching 1.00 as f_c increases.
- The curve's slope steepens between f_c = 0.4 and 0.8, then plateaus near f_c = 1.0.
### Key Observations
1. **Positive Correlation**: f_coh increases monotonically with f_c, suggesting a direct relationship.
2. **Model Fit**: Experimental data points align closely with the theoretical model, with error bars within the shaded confidence interval.
3. **Inset Insight**: The zoomed-in view reveals a steeper slope in the high-f_c region (0.6–1.0), indicating a nonlinear relationship.
4. **Uncertainty**: Error bars decrease as f_c increases, implying higher precision in measurements at higher f_c values.
### Interpretation
The chart demonstrates that f_coh is strongly dependent on f_c, with the theoretical model accurately predicting experimental outcomes. The confidence interval (±1σ) suggests the model's predictions are reliable within this uncertainty range. The inset highlights that the relationship becomes more sensitive to changes in f_c at higher values, which could imply a threshold effect or saturation behavior near f_c = 1.0. The decreasing error bars at higher f_c values may reflect improved measurement techniques or reduced variability in the system under study. This data could be critical for optimizing systems where f_c and f_coh are interdependent parameters, such as in signal processing or material science applications.