\n
## Line Chart: Accuracy vs. Sample Size
### Overview
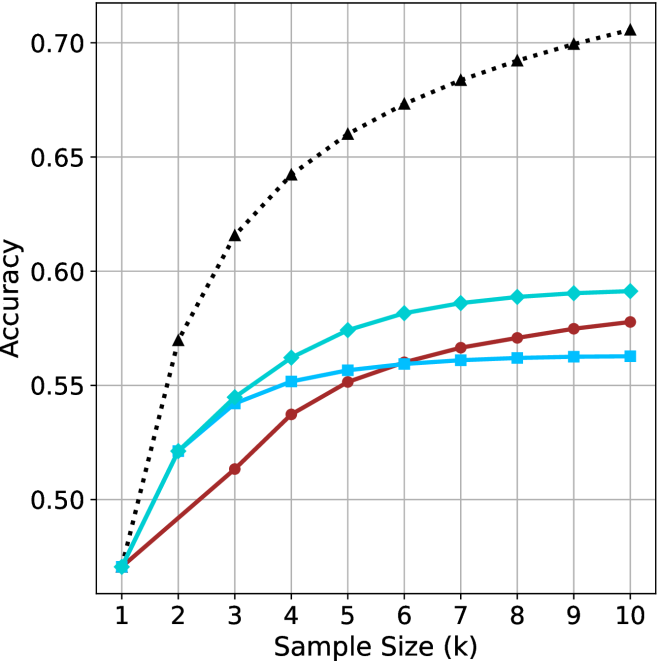
This image presents a line chart illustrating the relationship between sample size and accuracy. The chart displays three distinct data series, each represented by a different colored line, showing how accuracy changes as the sample size increases from 1k to 10k. The chart has a grid background for easier readability.
### Components/Axes
* **X-axis:** Labeled "Sample Size (k)", ranging from 1 to 10, with increments of 1.
* **Y-axis:** Labeled "Accuracy", ranging from 0.50 to 0.70, with increments of 0.05.
* **Data Series 1:** Represented by a black dotted line.
* **Data Series 2:** Represented by a cyan line.
* **Data Series 3:** Represented by a red line.
* **Grid:** A light gray grid is present in the background to aid in reading values.
### Detailed Analysis
**Data Series 1 (Black Dotted Line):** This line exhibits a steep upward trend initially, then gradually plateaus.
* At Sample Size = 1k, Accuracy ≈ 0.48
* At Sample Size = 2k, Accuracy ≈ 0.58
* At Sample Size = 3k, Accuracy ≈ 0.62
* At Sample Size = 4k, Accuracy ≈ 0.66
* At Sample Size = 5k, Accuracy ≈ 0.67
* At Sample Size = 6k, Accuracy ≈ 0.68
* At Sample Size = 7k, Accuracy ≈ 0.69
* At Sample Size = 8k, Accuracy ≈ 0.69
* At Sample Size = 9k, Accuracy ≈ 0.70
* At Sample Size = 10k, Accuracy ≈ 0.70
**Data Series 2 (Cyan Line):** This line shows a moderate upward trend that levels off significantly.
* At Sample Size = 1k, Accuracy ≈ 0.54
* At Sample Size = 2k, Accuracy ≈ 0.56
* At Sample Size = 3k, Accuracy ≈ 0.57
* At Sample Size = 4k, Accuracy ≈ 0.58
* At Sample Size = 5k, Accuracy ≈ 0.59
* At Sample Size = 6k, Accuracy ≈ 0.59
* At Sample Size = 7k, Accuracy ≈ 0.59
* At Sample Size = 8k, Accuracy ≈ 0.59
* At Sample Size = 9k, Accuracy ≈ 0.59
* At Sample Size = 10k, Accuracy ≈ 0.59
**Data Series 3 (Red Line):** This line demonstrates a slower, more gradual increase in accuracy, also leveling off.
* At Sample Size = 1k, Accuracy ≈ 0.46
* At Sample Size = 2k, Accuracy ≈ 0.50
* At Sample Size = 3k, Accuracy ≈ 0.53
* At Sample Size = 4k, Accuracy ≈ 0.55
* At Sample Size = 5k, Accuracy ≈ 0.56
* At Sample Size = 6k, Accuracy ≈ 0.57
* At Sample Size = 7k, Accuracy ≈ 0.57
* At Sample Size = 8k, Accuracy ≈ 0.57
* At Sample Size = 9k, Accuracy ≈ 0.57
* At Sample Size = 10k, Accuracy ≈ 0.57
### Key Observations
* Data Series 1 consistently outperforms the other two series across all sample sizes.
* The rate of accuracy improvement diminishes for all series as the sample size increases, indicating diminishing returns.
* Data Series 3 starts with the lowest accuracy and exhibits the slowest growth.
* Data Series 2 shows a moderate improvement, falling between the other two.
### Interpretation
The chart demonstrates the impact of sample size on accuracy. The rapid initial increase in accuracy for Data Series 1 suggests that, for this particular model or process, a small increase in sample size yields a significant improvement in performance. However, the flattening of all curves indicates that beyond a certain point (around 6k-7k for Data Series 1), increasing the sample size provides only marginal gains in accuracy. This suggests an optimal sample size exists, beyond which further data collection may not be cost-effective. The differences between the three data series could represent different algorithms, models, or data preprocessing techniques, with Data Series 1 being the most effective and Data Series 3 the least. The chart highlights the importance of balancing sample size with accuracy requirements and resource constraints.