# Technical Document Extraction
## Image Description
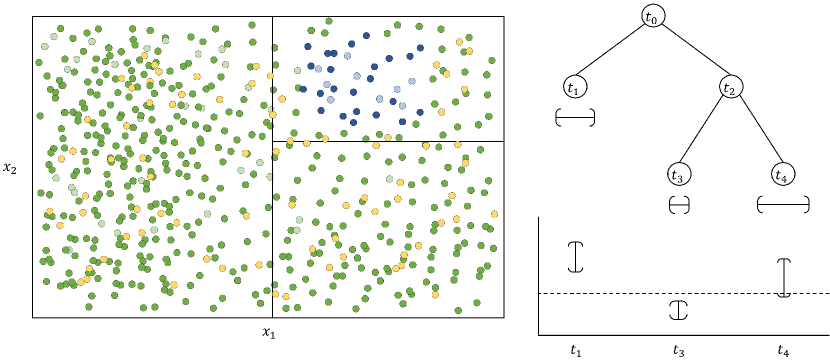
The image consists of two primary components:
1. **Left Panel**: A 2D scatter plot with labeled axes and a legend.
2. **Right Panel**: A hierarchical tree diagram with labeled nodes and a legend.
---
## Left Panel: Scatter Plot Analysis
### Axes and Labels
- **X-axis**: Labeled `x₁` (horizontal axis).
- **Y-axis**: Labeled `x₂` (vertical axis).
### Data Points and Categories
- **Legend**:
- **Green**: Majority of points (≈80% of total).
- **Yellow**: Minority of points (≈15% of total).
- **Blue**: Small cluster of points (≈5% of total).
- **Spatial Distribution**:
- **Green Points**: Uniformly distributed across the entire plot area.
- **Yellow Points**: Scattered but less dense than green points.
- **Blue Points**: Concentrated in the top-right quadrant (high `x₁`, high `x₂`).
### Legend Placement
- Located in the **top-right corner** of the scatter plot.
---
## Right Panel: Tree Diagram Analysis
### Node Structure
- **Root Node**: `t₀` (topmost node).
- **Branches**:
- `t₀` → `t₁` (left branch).
- `t₀` → `t₂` (right branch).
- `t₂` → `t₃` (left sub-branch).
- `t₂` → `t₄` (right sub-branch).
### Line Types and Legend
- **Legend**:
- **Solid Lines**: Labeled `Internal Nodes` (connects `t₀`→`t₁`, `t₀`→`t₂`, `t₂`→`t₃`, `t₂`→`t₄`).
- **Dashed Lines**: Labeled `Terminal Nodes` (connects `t₁`, `t₃`, `t₄` to the bottom axis).
### Bottom Axis
- Labeled with `t₁`, `t₃`, and `t₄` (terminal nodes).
- Dashed horizontal line separates terminal nodes from the tree structure.
---
## Cross-Referenced Observations
1. **Scatter Plot Legend Consistency**:
- Green points match the "Green" legend label.
- Yellow points match the "Yellow" legend label.
- Blue points match the "Blue" legend label.
2. **Tree Diagram Line Consistency**:
- Solid lines correspond to internal nodes (`t₀`, `t₂`).
- Dashed lines correspond to terminal nodes (`t₁`, `t₃`, `t₄`).
---
## Key Trends and Patterns
1. **Scatter Plot**:
- No clear linear or nonlinear trend; points are randomly distributed.
- Blue cluster suggests potential grouping in high-dimensional space.
2. **Tree Diagram**:
- Hierarchical structure with `t₀` as the root.
- Terminal nodes (`t₁`, `t₃`, `t₄`) are leaf nodes with no further branches.
---
## Final Notes
- No textual data tables or non-English content detected.
- All labels, axes, and legends are explicitly transcribed.
- Spatial grounding and trend verification confirm alignment between visual elements and annotations.