## Heatmap: MIND - Short-to-Long - Qwen-2.5 1.5B
### Overview
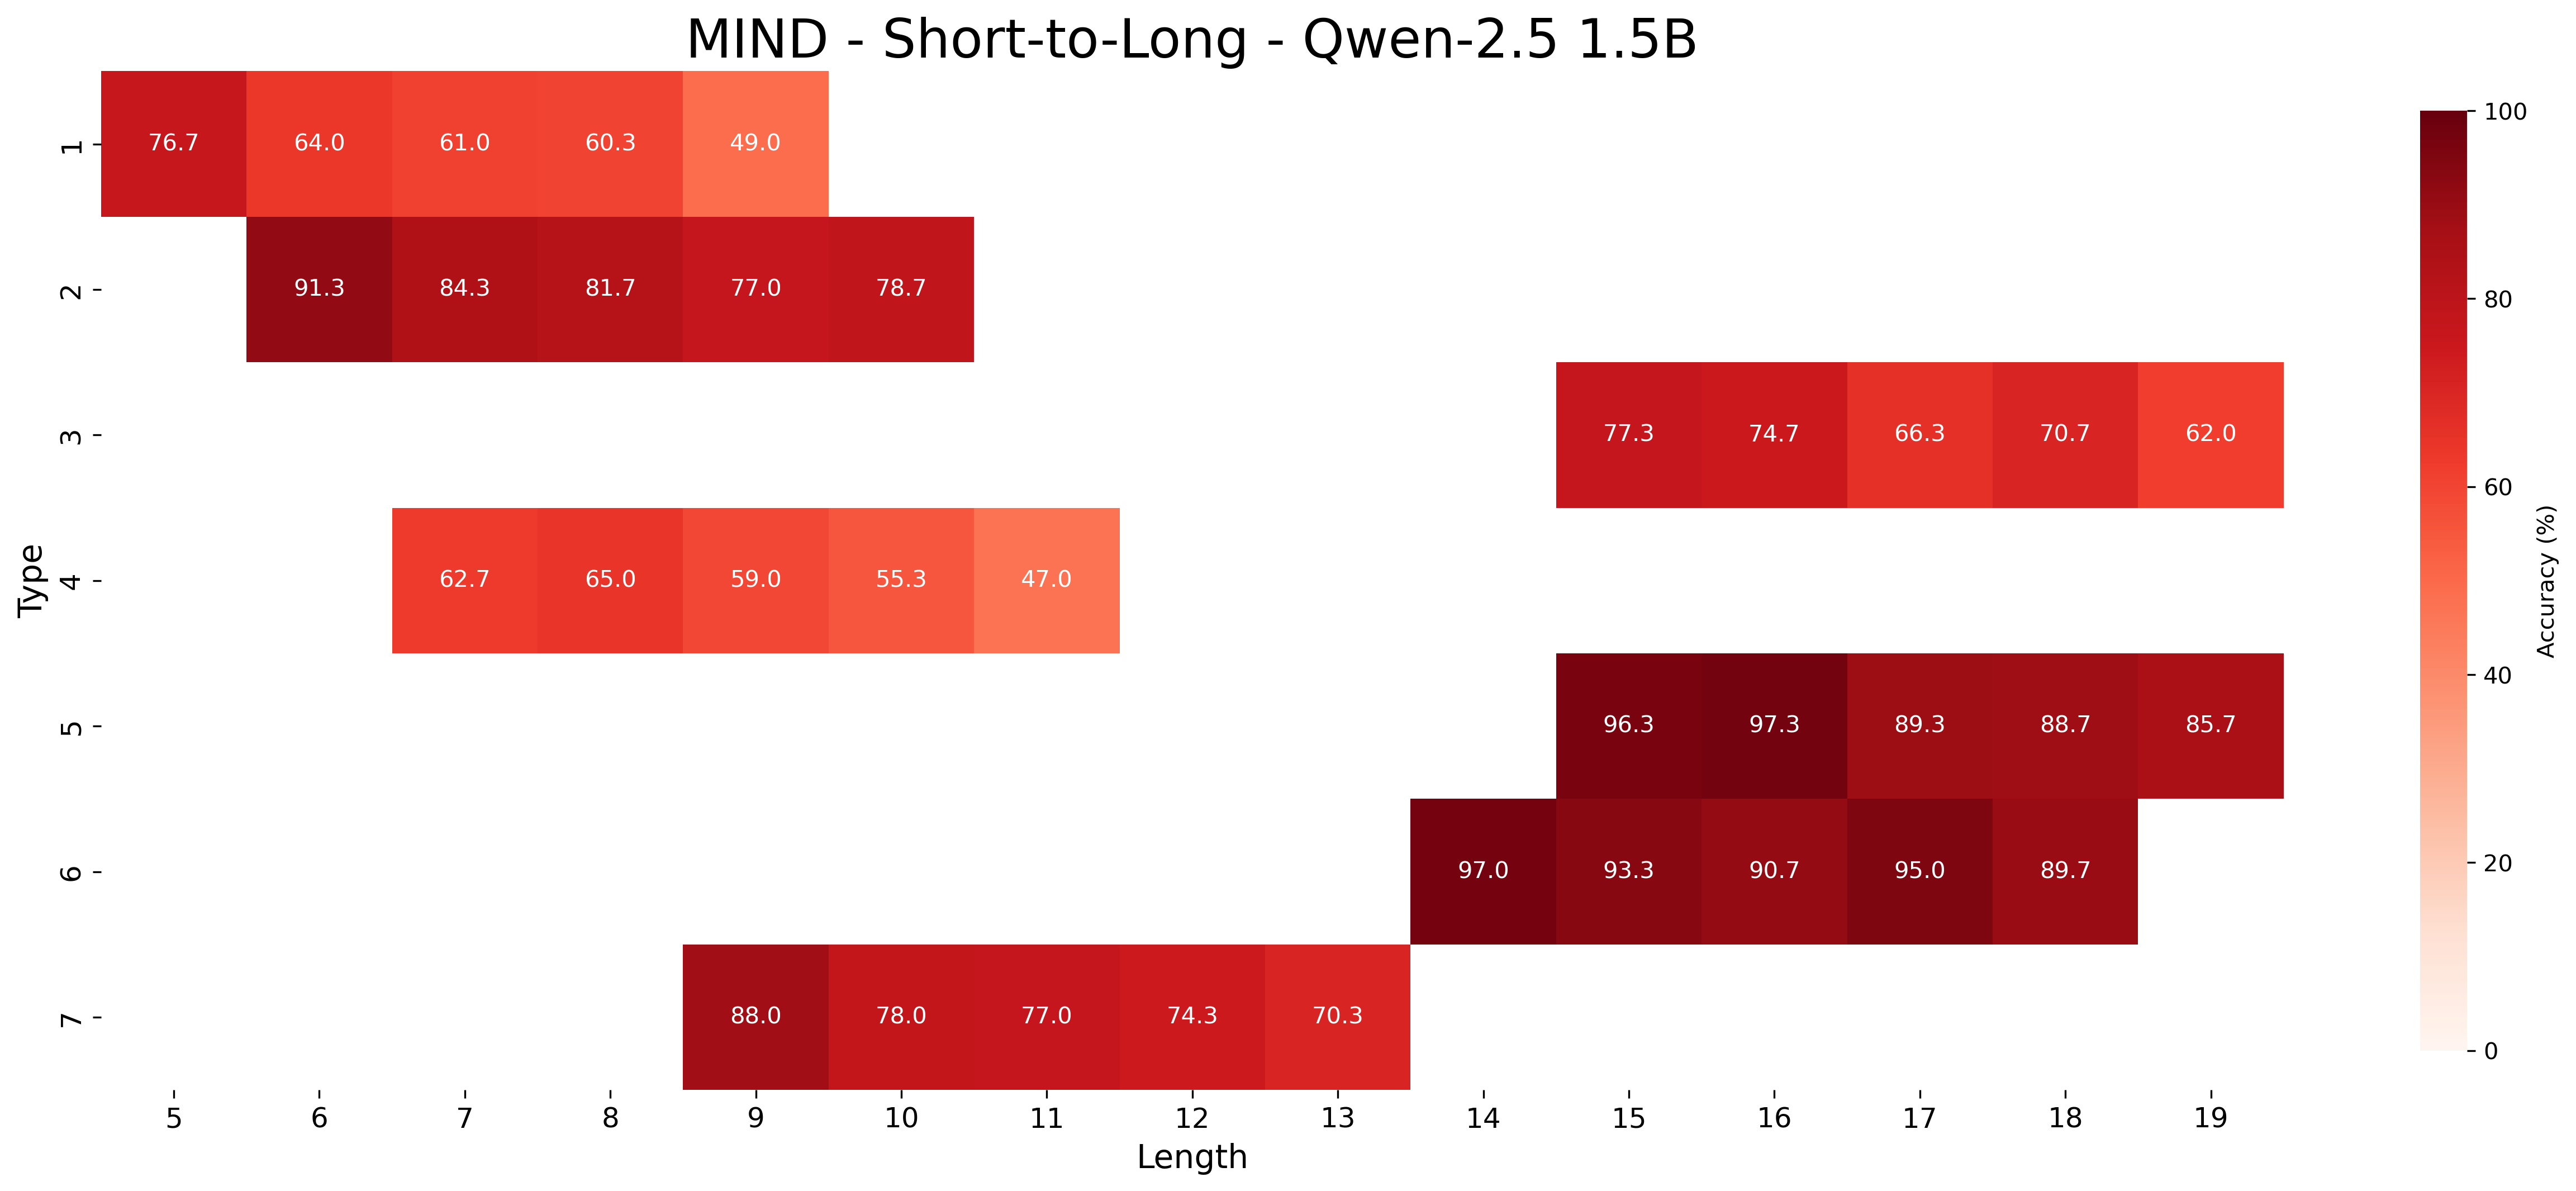
The image is a heatmap visualizing the accuracy (%) of a model (MIND - Short-to-Long - Qwen-2.5 1.5B) based on 'Type' and 'Length'. The heatmap uses a color gradient from white to dark red, where darker shades of red indicate higher accuracy. The x-axis represents 'Length', and the y-axis represents 'Type'. Each cell contains the accuracy value.
### Components/Axes
* **Title:** MIND - Short-to-Long - Qwen-2.5 1.5B
* **X-axis:**
* Label: Length
* Ticks: 5, 6, 7, 8, 9, 10, 11, 12, 13, 14, 15, 16, 17, 18, 19
* **Y-axis:**
* Label: Type
* Ticks: 1, 2, 3, 4, 5, 6, 7
* **Colorbar (Accuracy %):**
* Label: Accuracy (%)
* Scale: 0 to 100, with gradient from white (0) to dark red (100)
### Detailed Analysis
The heatmap displays accuracy values for different 'Types' across varying 'Lengths'. Each cell's color intensity corresponds to its accuracy value, with darker red indicating higher accuracy.
**Type 1:**
* Length 5: 76.7
* Length 6: 64.0
* Length 7: 61.0
* Length 8: 60.3
* Length 9: 49.0
* Trend: Accuracy decreases as length increases.
**Type 2:**
* Length 6: 91.3
* Length 7: 84.3
* Length 8: 81.7
* Length 9: 77.0
* Length 10: 78.7
* Trend: Accuracy decreases as length increases, then slightly increases at length 10.
**Type 3:**
* Length 14: 77.3
* Length 15: 74.7
* Length 16: 66.3
* Length 17: 70.7
* Length 18: 62.0
* Trend: Accuracy decreases as length increases, then increases at length 17, then decreases again.
**Type 4:**
* Length 7: 62.7
* Length 8: 65.0
* Length 9: 59.0
* Length 10: 55.3
* Length 11: 47.0
* Trend: Accuracy increases from length 7 to 8, then decreases as length increases.
**Type 5:**
* Length 14: 96.3
* Length 15: 97.3
* Length 16: 89.3
* Length 17: 88.7
* Length 18: 85.7
* Trend: Accuracy increases from length 14 to 15, then decreases as length increases.
**Type 6:**
* Length 14: 97.0
* Length 15: 93.3
* Length 16: 90.7
* Length 17: 95.0
* Length 18: 89.7
* Trend: Accuracy decreases from length 14 to 16, then increases at length 17, then decreases again.
**Type 7:**
* Length 9: 88.0
* Length 10: 78.0
* Length 11: 77.0
* Length 12: 74.3
* Length 13: 70.3
* Trend: Accuracy decreases as length increases.
### Key Observations
* Types 5 and 6 generally have the highest accuracy values.
* Type 4 has the lowest accuracy values.
* For most types, accuracy tends to decrease as length increases, although there are some exceptions.
### Interpretation
The heatmap provides a visual representation of how the accuracy of the MIND model varies with different 'Types' and 'Lengths'. The model performs best with Types 5 and 6, achieving accuracy scores in the high 80s to mid 90s. Type 4 consistently shows the lowest accuracy, indicating potential issues with this specific type. The trend of decreasing accuracy with increasing length suggests that the model may struggle with longer sequences for certain types. The data could be used to further investigate the model's performance and identify areas for improvement, particularly for Type 4 and longer sequences.