\n
## Heatmap: MIND - Short-to-Long - Qwen-2.5 1.5B
### Overview
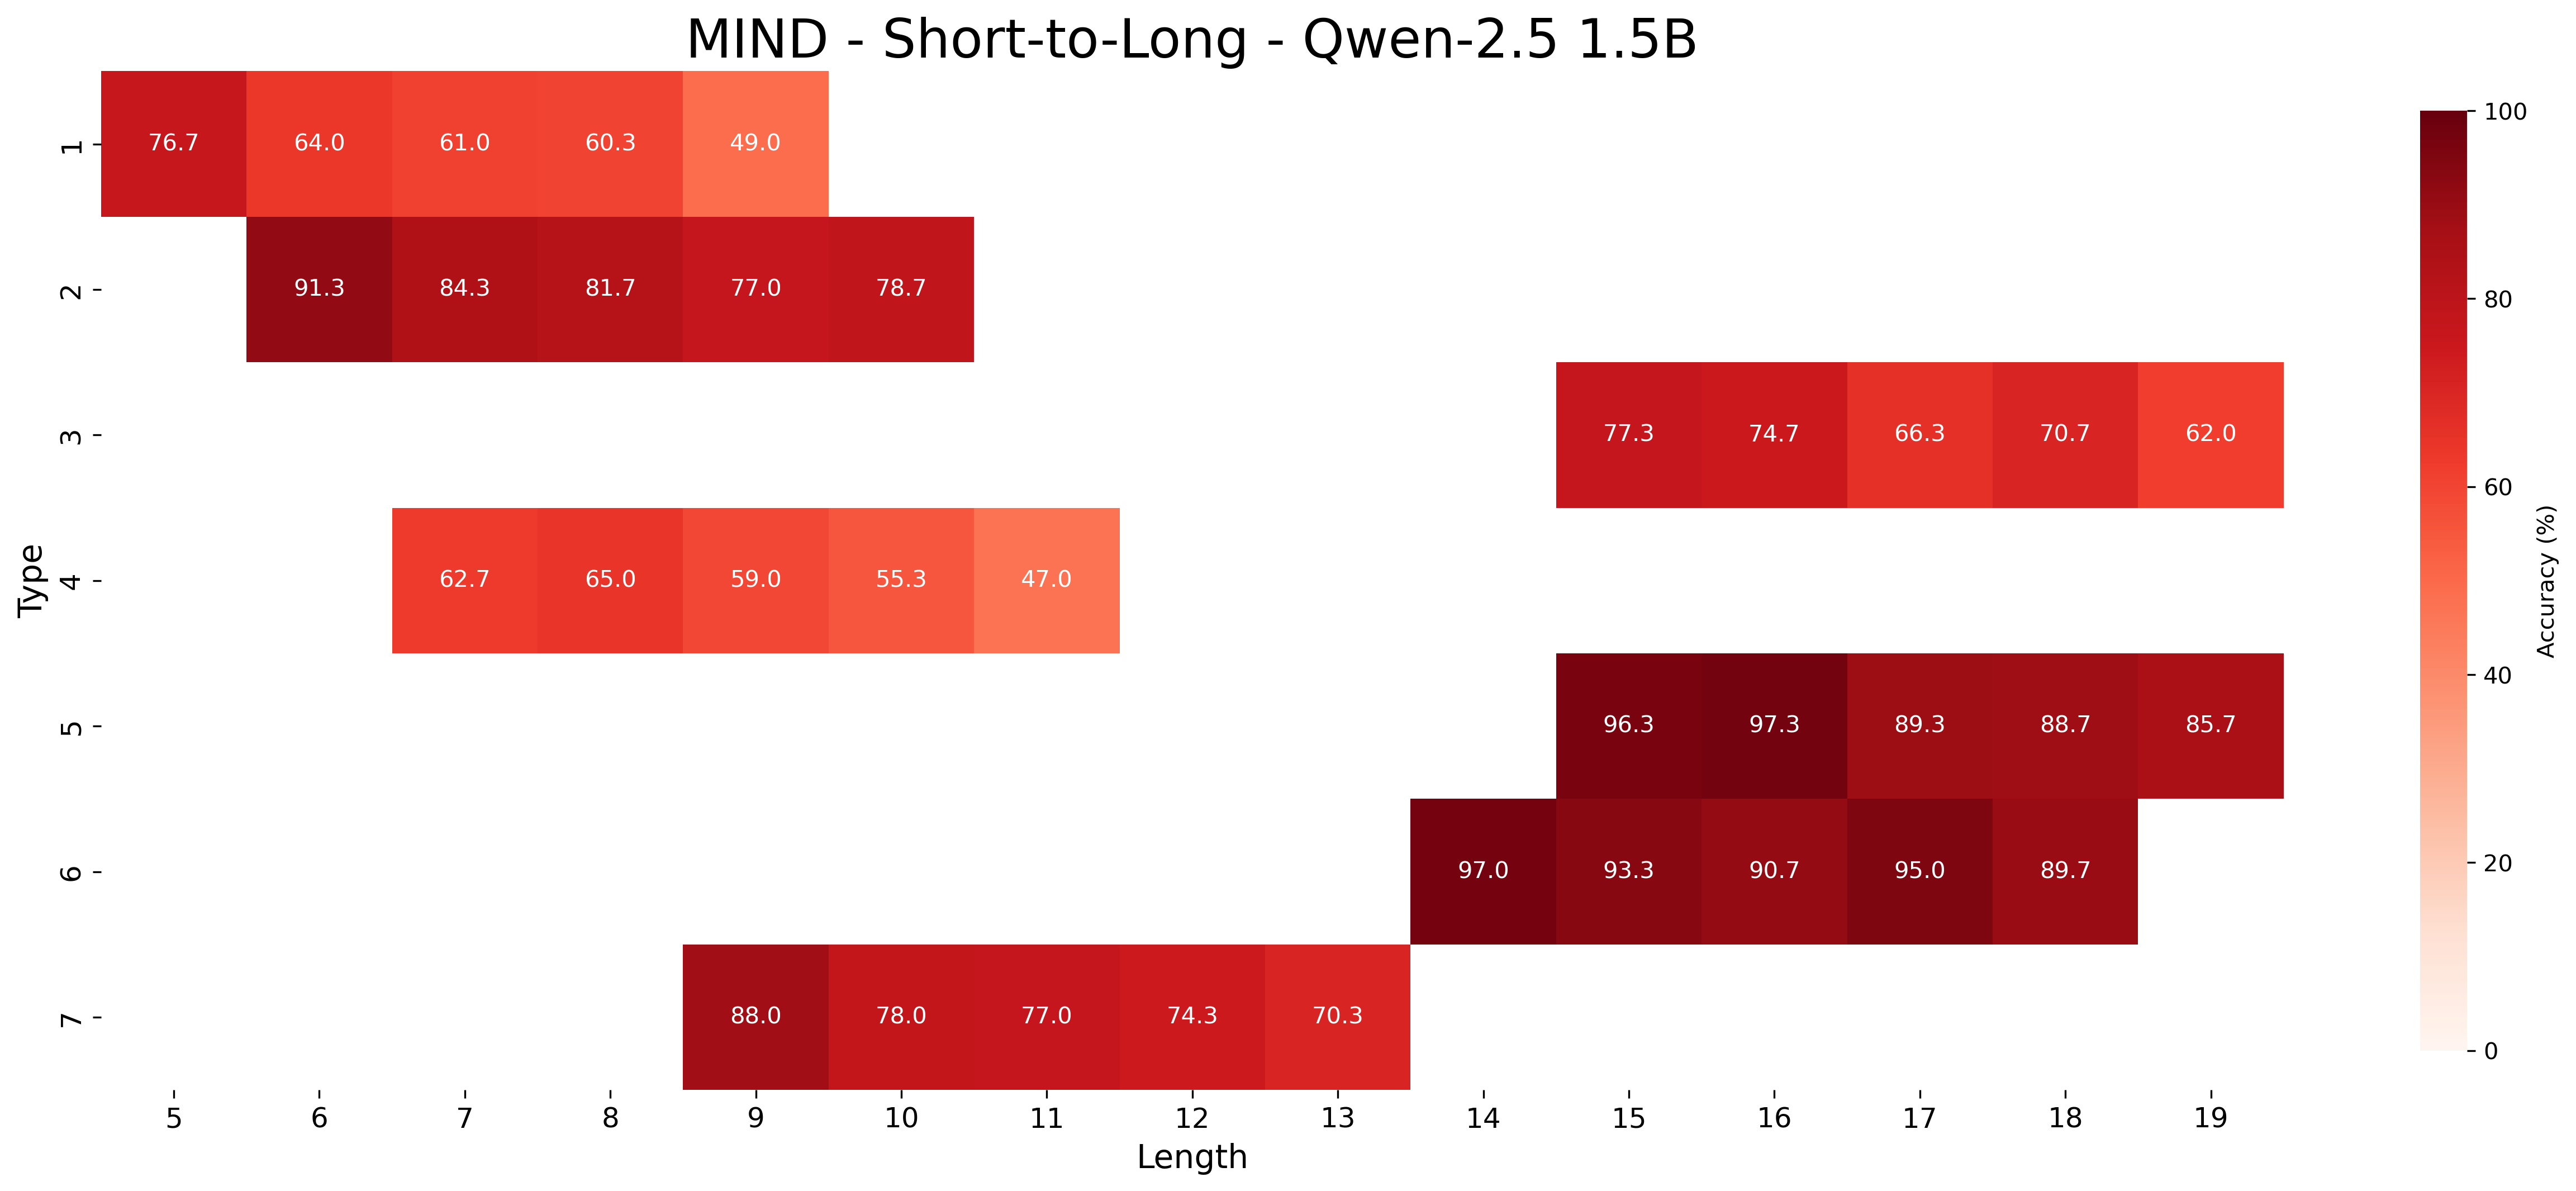
This image presents a heatmap visualizing the accuracy of a model (Qwen-2.5 1.5B) on a task called "MIND - Short-to-Long". The heatmap displays accuracy as a function of two categorical variables: "Type" (ranging from 1 to 7) and "Length" (ranging from 5 to 19). The color intensity represents the accuracy percentage, with darker reds indicating higher accuracy and lighter shades indicating lower accuracy.
### Components/Axes
* **Title:** MIND - Short-to-Long - Qwen-2.5 1.5B (Top-center)
* **X-axis:** Length (Horizontal axis, bottom) - Values: 5, 6, 7, 8, 9, 10, 11, 12, 13, 14, 15, 16, 17, 18, 19
* **Y-axis:** Type (Vertical axis, left) - Values: 1, 2, 3, 4, 5, 6, 7
* **Colorbar:** Accuracy (%) (Right side) - Scale ranges from approximately 0% (white) to 100% (dark red).
### Detailed Analysis
The heatmap is structured as a grid with 7 rows (Types) and 15 columns (Lengths). Each cell contains a numerical value representing the accuracy percentage.
Here's a breakdown of the accuracy values, row by row:
* **Type 1:** 76.7% (Length 5), 64.0% (Length 6), 60.3% (Length 7), 60.3% (Length 8), 49.0% (Length 9)
* **Type 2:** 91.3% (Length 5), 84.3% (Length 6), 81.7% (Length 7), 77.0% (Length 8), 78.7% (Length 9)
* **Type 3:** 77.3% (Length 14), 74.7% (Length 15), 66.3% (Length 16), 70.7% (Length 17), 62.0% (Length 18)
* **Type 4:** 62.7% (Length 5), 65.0% (Length 6), 59.0% (Length 7), 55.3% (Length 8), 47.0% (Length 9)
* **Type 5:** 96.3% (Length 14), 97.3% (Length 15), 89.3% (Length 16), 88.7% (Length 17), 85.7% (Length 18)
* **Type 6:** 97.0% (Length 14), 93.3% (Length 15), 95.0% (Length 16), 89.7% (Length 17)
* **Type 7:** 88.0% (Length 9), 78.0% (Length 10), 77.0% (Length 11), 74.3% (Length 12), 70.3% (Length 13)
**Trends:**
* For Type 1, accuracy decreases as length increases from 5 to 9.
* For Type 2, accuracy generally decreases as length increases from 5 to 9.
* For Type 3, accuracy fluctuates with length, peaking at 14.
* For Type 4, accuracy decreases as length increases from 5 to 9.
* For Type 5, accuracy is high and decreases slightly as length increases from 14 to 18.
* For Type 6, accuracy is very high and decreases slightly as length increases from 14 to 17.
* For Type 7, accuracy decreases as length increases from 9 to 13.
### Key Observations
* Types 5 and 6 consistently exhibit the highest accuracy values, particularly for lengths between 14 and 17.
* Type 4 consistently exhibits the lowest accuracy values.
* Accuracy generally decreases for Types 1, 2, 4, and 7 as the length increases.
* There is a clear separation in the length ranges where different types are evaluated. Types 1, 2, 4, and 7 are evaluated at lengths 5-9, while Types 3, 5, and 6 are evaluated at lengths 14-18.
### Interpretation
The heatmap demonstrates the performance of the Qwen-2.5 1.5B model on the MIND Short-to-Long task, categorized by "Type" and "Length". The data suggests that the model performs significantly better on Types 5 and 6, regardless of the length within the evaluated range (14-18). Conversely, the model struggles with Type 4, consistently achieving lower accuracy scores. The varying performance across different lengths for Types 1, 2, 4, and 7 indicates that the model's ability to handle the task is sensitive to the input length. The distinct length ranges used for different types suggest that these types may represent different sub-tasks or difficulty levels within the broader MIND Short-to-Long task. The heatmap provides valuable insights into the model's strengths and weaknesses, which can be used to guide further model development and optimization. The separation of length ranges for different types suggests a deliberate experimental design to assess performance under varying conditions.