## Heatmap: MIND - Short-to-Long - Qwen-2.5 1.5B
### Overview
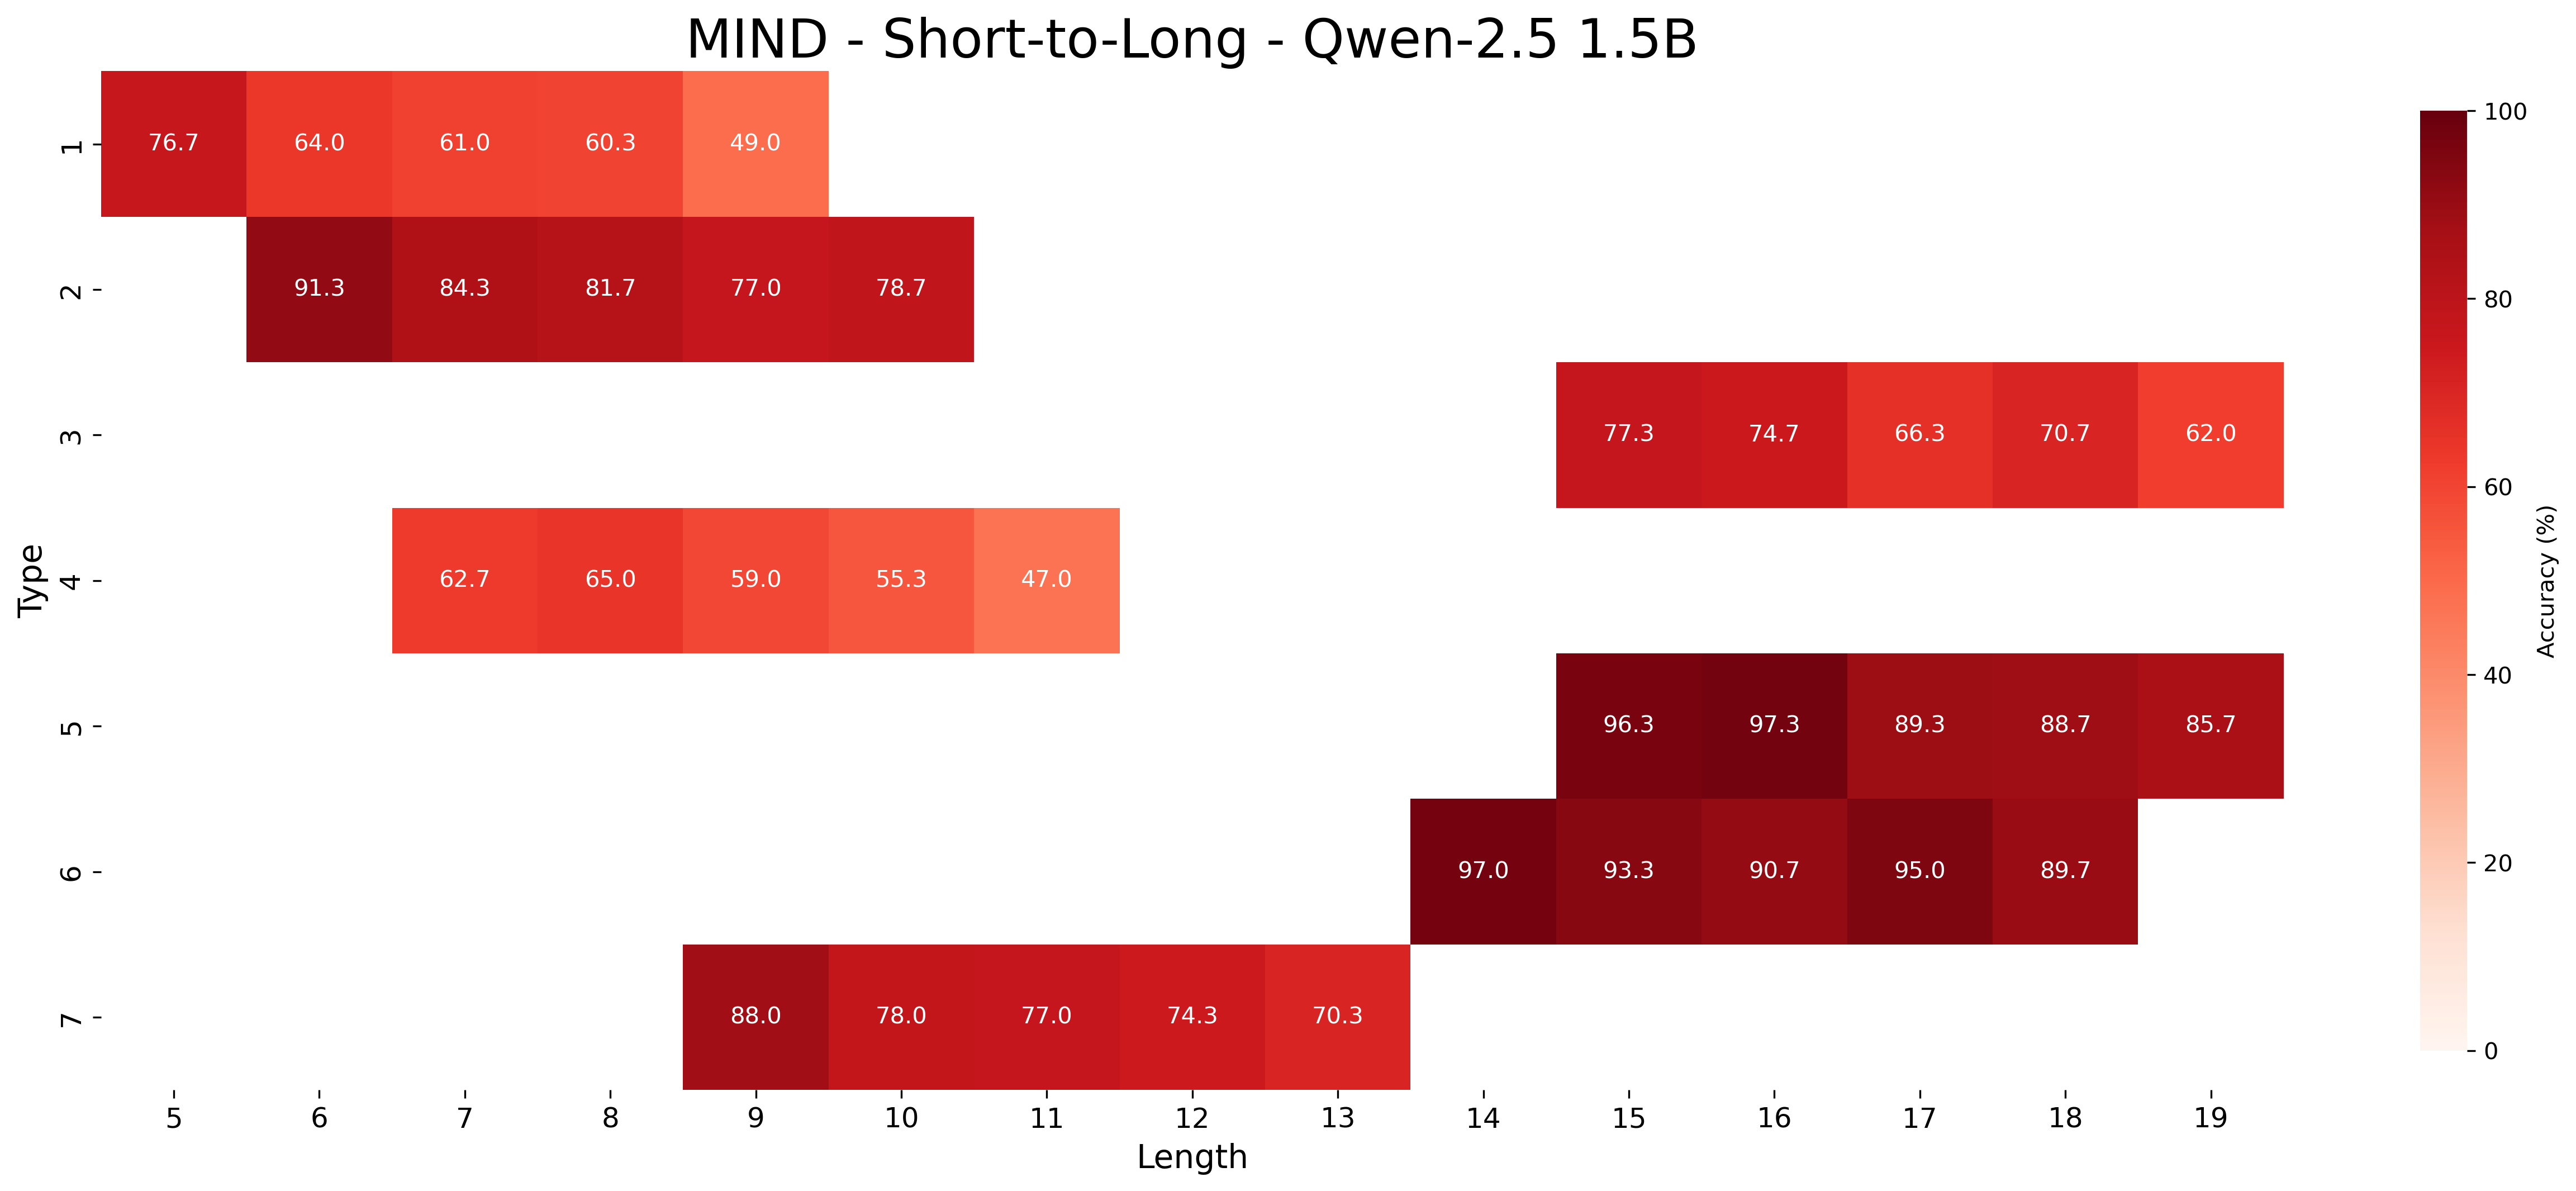
This image is a heatmap visualizing the accuracy performance of a model named "Qwen-2.5 1.5B" on a task or dataset referred to as "MIND," specifically focusing on a "Short-to-Long" evaluation. The chart plots accuracy percentages against two categorical variables: "Type" (y-axis) and "Length" (x-axis). The data is presented as a grid of colored cells, where each cell's color intensity corresponds to an accuracy value, with darker reds indicating higher accuracy.
### Components/Axes
* **Title:** "MIND - Short-to-Long - Qwen-2.5 1.5B" (Top center).
* **Y-Axis (Vertical):** Labeled "Type". It contains 7 discrete categories, numbered 1 through 7 from top to bottom.
* **X-Axis (Horizontal):** Labeled "Length". It contains 15 discrete categories, numbered 5 through 19 from left to right.
* **Legend/Color Bar:** Located on the right side of the chart. It is a vertical gradient bar labeled "Accuracy (%)". The scale runs from 0 (light peach/white) at the bottom to 100 (dark red) at the top, with intermediate tick marks at 20, 40, 60, and 80.
* **Data Cells:** The main chart area is a grid where rows correspond to "Type" and columns correspond to "Length". Not all grid cells are populated; data is present only for specific Type-Length combinations. Each populated cell contains a numerical value representing the accuracy percentage.
### Detailed Analysis
The following table reconstructs the data from the heatmap. An empty cell indicates no data was recorded for that Type-Length combination.
| Type | Length 5 | Length 6 | Length 7 | Length 8 | Length 9 | Length 10 | Length 11 | Length 12 | Length 13 | Length 14 | Length 15 | Length 16 | Length 17 | Length 18 | Length 19 |
| :--- | :--- | :--- | :--- | :--- | :--- | :--- | :--- | :--- | :--- | :--- | :--- | :--- | :--- | :--- | :--- |
| **1** | 76.7 | 64.0 | 61.0 | 60.3 | 49.0 | | | | | | | | | | |
| **2** | | 91.3 | 84.3 | 81.7 | 77.0 | 78.7 | | | | | | | | | |
| **3** | | | | | | | | | | | 77.3 | 74.7 | 66.3 | 70.7 | 62.0 |
| **4** | | | 62.7 | 65.0 | 59.0 | 55.3 | 47.0 | | | | | | | | |
| **5** | | | | | | | | | | | 96.3 | 97.3 | 89.3 | 88.7 | 85.7 |
| **6** | | | | | | | | | | 97.0 | 93.3 | 90.7 | 95.0 | 89.7 | |
| **7** | | | | | 88.0 | 78.0 | 77.0 | 74.3 | 70.3 | | | | | | |
**Trend Verification per Type:**
* **Type 1:** Shows a clear downward trend. Accuracy starts at 76.7% (Length 5) and decreases steadily to 49.0% (Length 9).
* **Type 2:** Shows a general downward trend with a slight uptick at the end. Accuracy decreases from 91.3% (Length 6) to 77.0% (Length 9), then rises slightly to 78.7% (Length 10).
* **Type 3:** Shows a general downward trend with fluctuation. Accuracy decreases from 77.3% (Length 15) to 66.3% (Length 17), rises to 70.7% (Length 18), then falls to 62.0% (Length 19).
* **Type 4:** Shows a downward trend. Accuracy peaks at 65.0% (Length 8) and then decreases to 47.0% (Length 11).
* **Type 5:** Shows a downward trend from a very high starting point. Accuracy peaks at 97.3% (Length 16) and decreases to 85.7% (Length 19).
* **Type 6:** Shows a fluctuating but generally high-performance trend. Accuracy starts at 97.0% (Length 14), dips, rises to 95.0% (Length 17), then falls to 89.7% (Length 18).
* **Type 7:** Shows a clear downward trend. Accuracy decreases from 88.0% (Length 9) to 70.3% (Length 13).
### Key Observations
1. **Performance Stratification by Type:** There is a stark difference in baseline performance between types. Types 5 and 6 consistently achieve very high accuracy (mostly >85%), while Types 1 and 4 operate at a much lower accuracy range (mostly <70%).
2. **Universal Negative Correlation with Length:** For every type where a trend is visible, accuracy decreases as the "Length" value increases. This is the most dominant pattern in the chart.
3. **Data Sparsity:** The evaluation is not uniform. Each type is tested over a specific, non-overlapping range of lengths (e.g., Type 1 only for lengths 5-9, Type 3 only for lengths 15-19). This suggests the "Types" may represent different task categories or difficulty levels that are naturally associated with different sequence lengths.
4. **High-Accuracy Cluster:** The highest accuracy values (≥90%) are concentrated in the lower-right quadrant of the populated data, specifically for Types 5 and 6 at lengths 14-18.
### Interpretation
This heatmap provides a diagnostic view of the Qwen-2.5 1.5B model's capabilities on the MIND benchmark. The data strongly suggests that **sequence length is a critical factor degrading model performance** across all evaluated task types. The model's accuracy is not robust to increases in the "Length" parameter.
The separation of data into distinct, non-overlapping blocks for each "Type" implies these types are fundamentally different sub-tasks. The model exhibits a clear hierarchy of competence: it excels at Types 5 and 6, performs moderately on Types 2, 3, and 7, and struggles significantly with Types 1 and 4. This could indicate that Types 5 and 6 involve simpler patterns or are more aligned with the model's pre-training, while Types 1 and 4 present more complex reasoning or retrieval challenges that break down as sequences get longer.
The investigation reveals a model that is highly sensitive to input length, with its strengths and weaknesses being task-dependent. To improve performance, focus would need to be placed on enhancing the model's ability to maintain coherence and accuracy over longer contexts, particularly for the lower-performing task types (1 and 4).