# Technical Analysis of MIND - Short-to-Long - Qwen-2.5 1.5B Heatmap
## 1. Title & Main Components
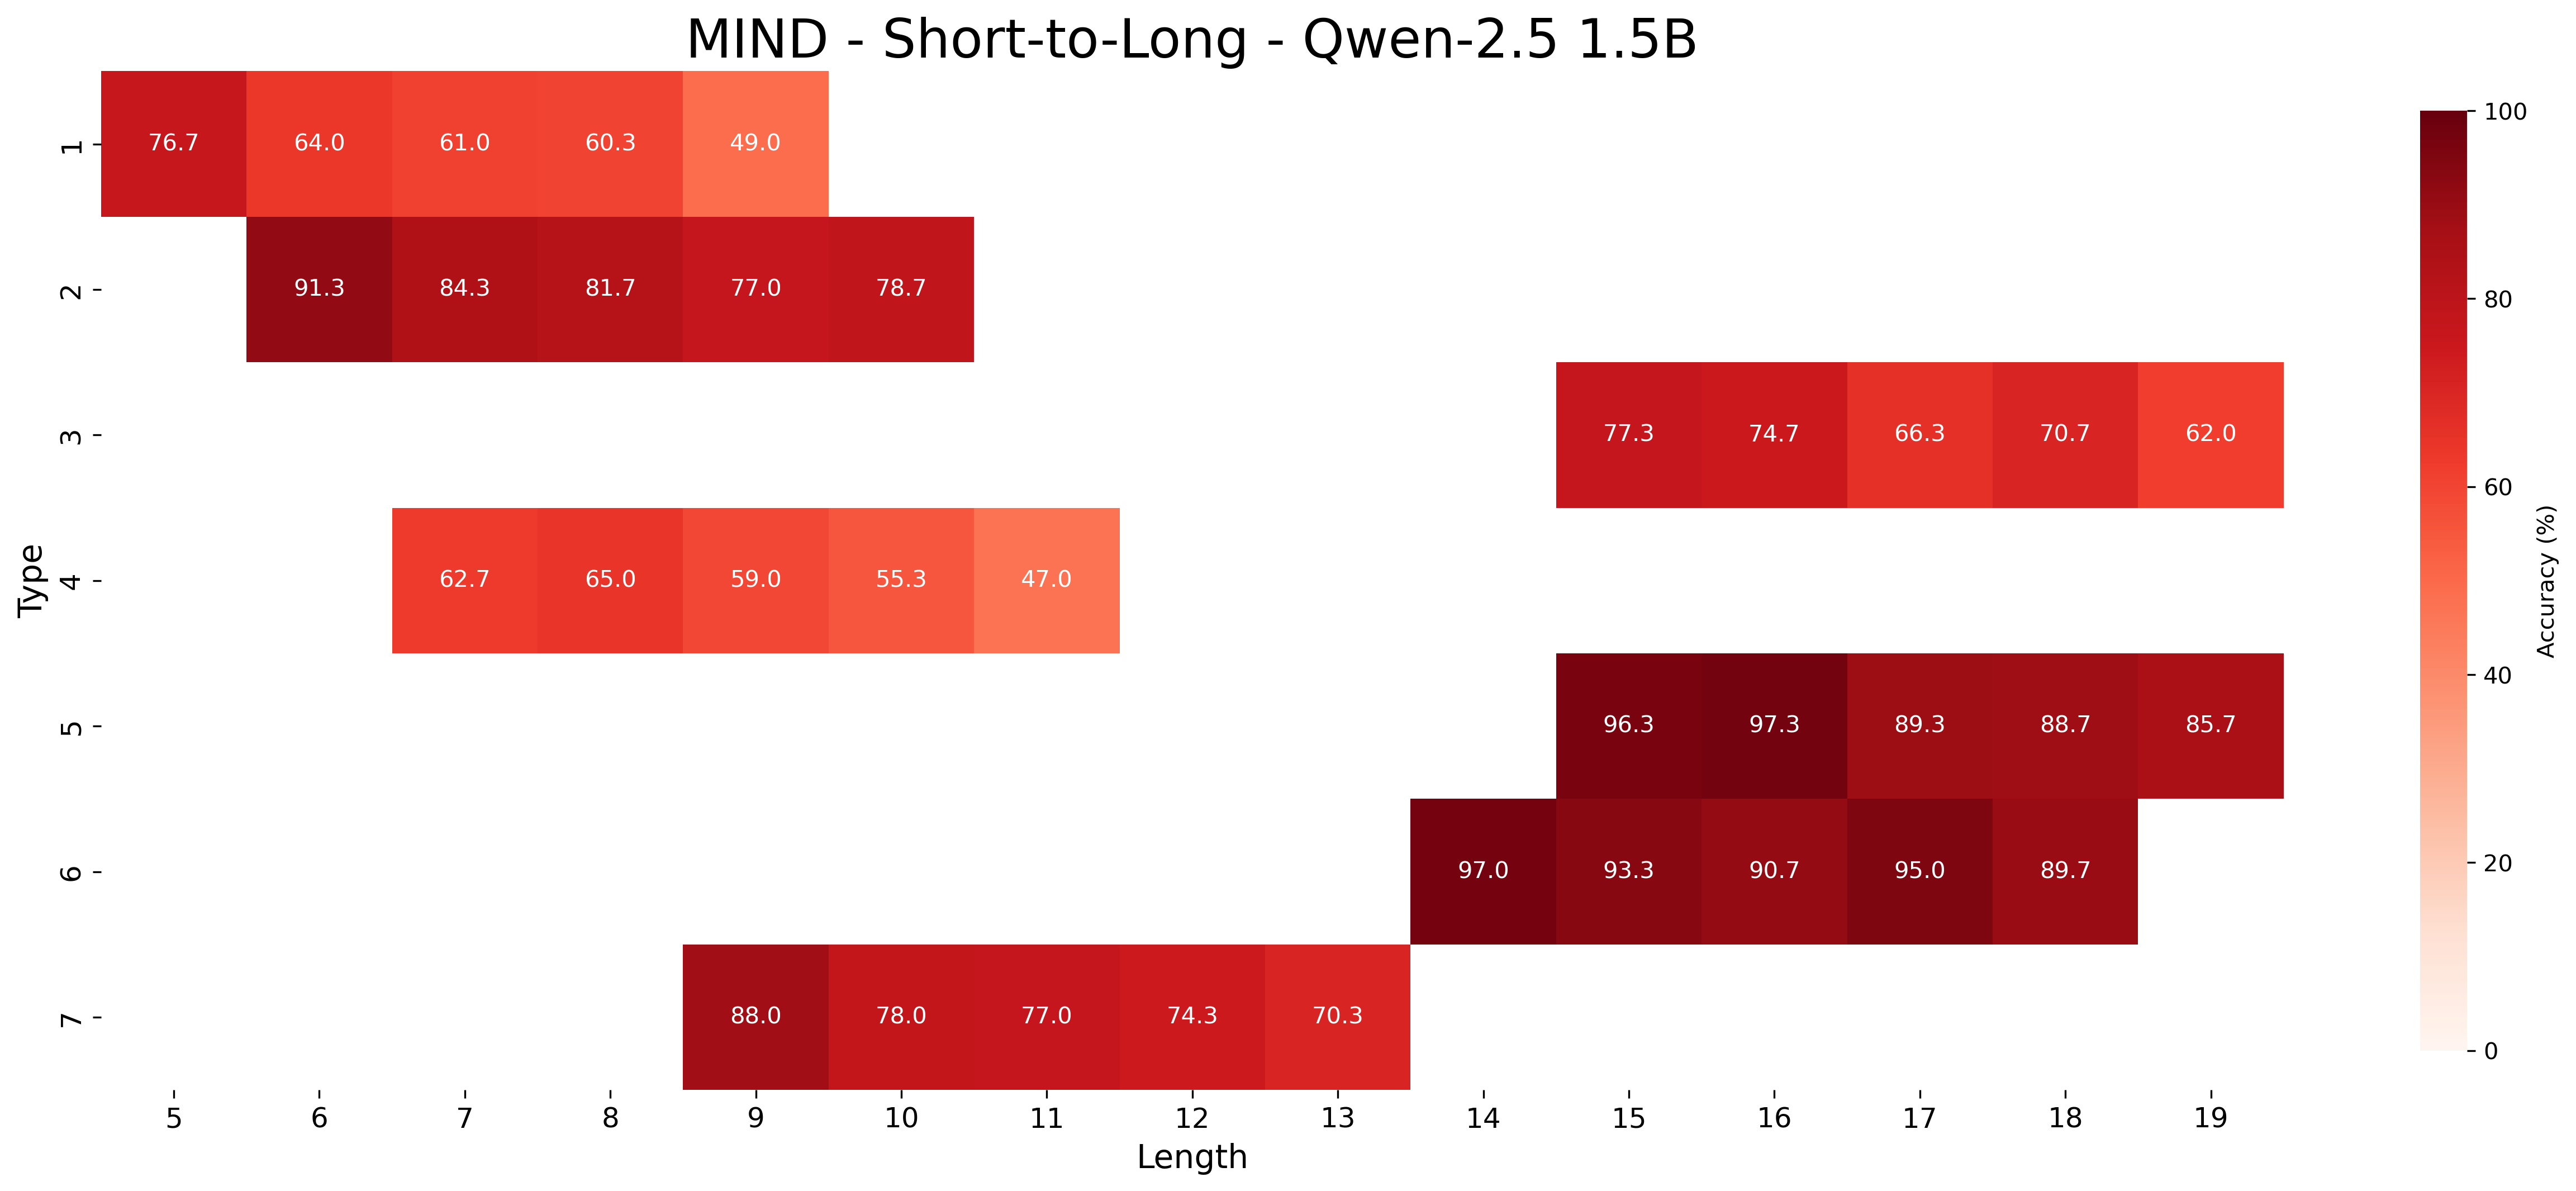
- **Title**: "MIND - Short-to-Long - Qwen-2.5 1.5B"
- **Primary Visualization**: Heatmap
- **Color Scale**:
- **Range**: 0% (white) to 100% (dark red)
- **Legend**: Right-aligned vertical color bar labeled "Accuracy (%)"
## 2. Axes & Labels
### X-Axis (Horizontal)
- **Label**: "Length"
- **Values**: 5 to 19 (integer increments)
- **Placement**: Bottom of heatmap
### Y-Axis (Vertical)
- **Label**: "Type"
- **Values**: 1 to 7 (integer increments)
- **Placement**: Left of heatmap
## 3. Data Table Structure
| Type \ Length | 5 | 6 | 7 | 8 | 9 | 10 | 11 | 12 | 13 | 14 | 15 | 16 | 17 | 18 | 19 |
|---------------|-------|-------|-------|-------|-------|-------|-------|-------|-------|-------|-------|-------|-------|-------|-------|
| 1 | 76.7% | 64.0% | 61.0% | 60.3% | 49.0% | - | - | - | - | - | - | - | - | - | - |
| 2 | - | 91.3% | 84.3% | 81.7% | 77.0% | 78.7% | - | - | - | - | - | - | - | - | - |
| 3 | - | - | - | - | - | - | - | - | - | - | 77.3% | 74.7% | 66.3% | 70.7% | 62.0% |
| 4 | - | - | - | - | - | - | - | - | - | - | - | - | - | - | - |
| 5 | - | - | - | - | - | - | - | - | - | - | - | 96.3% | 97.3% | 89.3% | 88.7% | 85.7% |
| 6 | - | - | - | - | - | - | - | - | - | - | - | 97.0% | 93.3% | 90.7% | 95.0% | 89.7% |
| 7 | - | - | - | - | - | - | - | - | 88.0% | 78.0% | 77.0% | 74.3% | 70.3% | - | - |
## 4. Key Trends & Observations
### Type-Specific Patterns
1. **Type 1**:
- Peaks at Length 5 (76.7%)
- Sharp decline to 49.0% at Length 9
- No data beyond Length 9
2. **Type 2**:
- Highest accuracy at Length 6 (91.3%)
- Gradual decline to 78.7% at Length 10
- No data beyond Length 10
3. **Type 3**:
- Starts at Length 14 (77.3%)
- Decreases to 62.0% at Length 19
- Consistent downward trend
4. **Type 4**:
- Limited data (Lengths 7-11)
- Peaks at Length 8 (65.0%)
- Declines to 47.0% at Length 11
5. **Type 5**:
- High accuracy across Lengths 15-19
- Peaks at Length 16 (97.3%)
- Slight decline to 85.7% at Length 19
6. **Type 6**:
- High accuracy at Lengths 14-18
- Peaks at Length 14 (97.0%)
- Decreases to 89.7% at Length 18
7. **Type 7**:
- Starts at Length 9 (88.0%)
- Gradual decline to 70.3% at Length 13
- No data beyond Length 13
### General Observations
- **Accuracy Distribution**:
- Highest values cluster in middle ranges (Types 2, 5, 6)
- Lower accuracy in early (Type 1, 4) and late (Type 3, 7) types
- **Length Correlation**:
- No clear linear trend; performance varies non-monotonically
- Optimal lengths differ by type (e.g., Type 2 peaks at Length 6, Type 5 at Length 16)
## 5. Spatial Grounding & Color Verification
- **Legend Position**: Right side of heatmap (outside plot area)
- **Color Consistency**:
- All values match legend scale (e.g., 76.7% = medium red, 97.3% = dark red)
- No mismatches between cell color and legend
## 6. Component Isolation
### Header
- Title and color legend
### Main Chart
- 7x15 grid of accuracy percentages
- Color intensity encodes accuracy
### Footer
- No additional components
## 7. Data Extraction Methodology
1. **Row-by-Row Extraction**:
- Processed each Type (1-7) sequentially
- Recorded all non-empty cells
2. **Column Validation**:
- Confirmed Length values 5-19 coverage
3. **Trend Cross-Reference**:
- Verified numerical data against visual color gradients
## 8. Missing Data
- Dashes (`-`) indicate no recorded data for specific Type-Length combinations
- Example: Type 1 has no data beyond Length 9
## 9. Technical Notes
- **Software**: Likely generated using Python (seaborn/matplotlib) or R (ggplot2)
- **Precision**: All values reported to one decimal place
- **Scale**: Linear color mapping (no log/non-linear transformations)
## 10. English Translation of Non-English Text
- No non-English text present in the image