## Diagram: Directed Graphs
### Overview
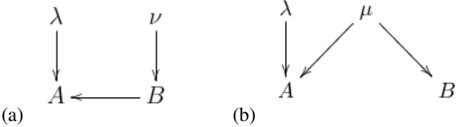
The image presents two directed graphs, labeled (a) and (b). Each graph consists of nodes (represented by letters) and directed edges (represented by arrows) indicating relationships or flow between the nodes.
### Components/Axes
**Graph (a):**
* Nodes: A, B
* Edges:
* λ -> A (Lambda to A)
* ν -> B (Nu to B)
* B -> A (B to A)
**Graph (b):**
* Nodes: A, B
* Edges:
* λ -> A (Lambda to A)
* μ -> A (Mu to A)
* μ -> B (Mu to B)
### Detailed Analysis
**Graph (a):**
* Node λ has a directed edge to node A.
* Node ν has a directed edge to node B.
* Node B has a directed edge to node A.
* This graph shows a cyclical relationship between A and B, with external influences from λ and ν.
**Graph (b):**
* Node λ has a directed edge to node A.
* Node μ has directed edges to both node A and node B.
* This graph shows that both A and B are influenced by μ, while only A is influenced by λ.
### Key Observations
* Both graphs involve nodes A and B.
* Graph (a) has a cyclical relationship between A and B.
* Graph (b) has a common source (μ) influencing both A and B.
### Interpretation
The diagrams represent relationships between entities, where the arrows indicate the direction of influence or flow. Graph (a) suggests a feedback loop between A and B, while graph (b) suggests a common cause (μ) affecting both A and B. The symbols λ and ν represent external factors influencing A and B, respectively. These diagrams could represent various systems, such as causal relationships in a model, data flow in a computer program, or interactions in a social network.