# Technical Document Extraction: Cluster Monitoring and Mitigation Workflow
## Diagram Overview
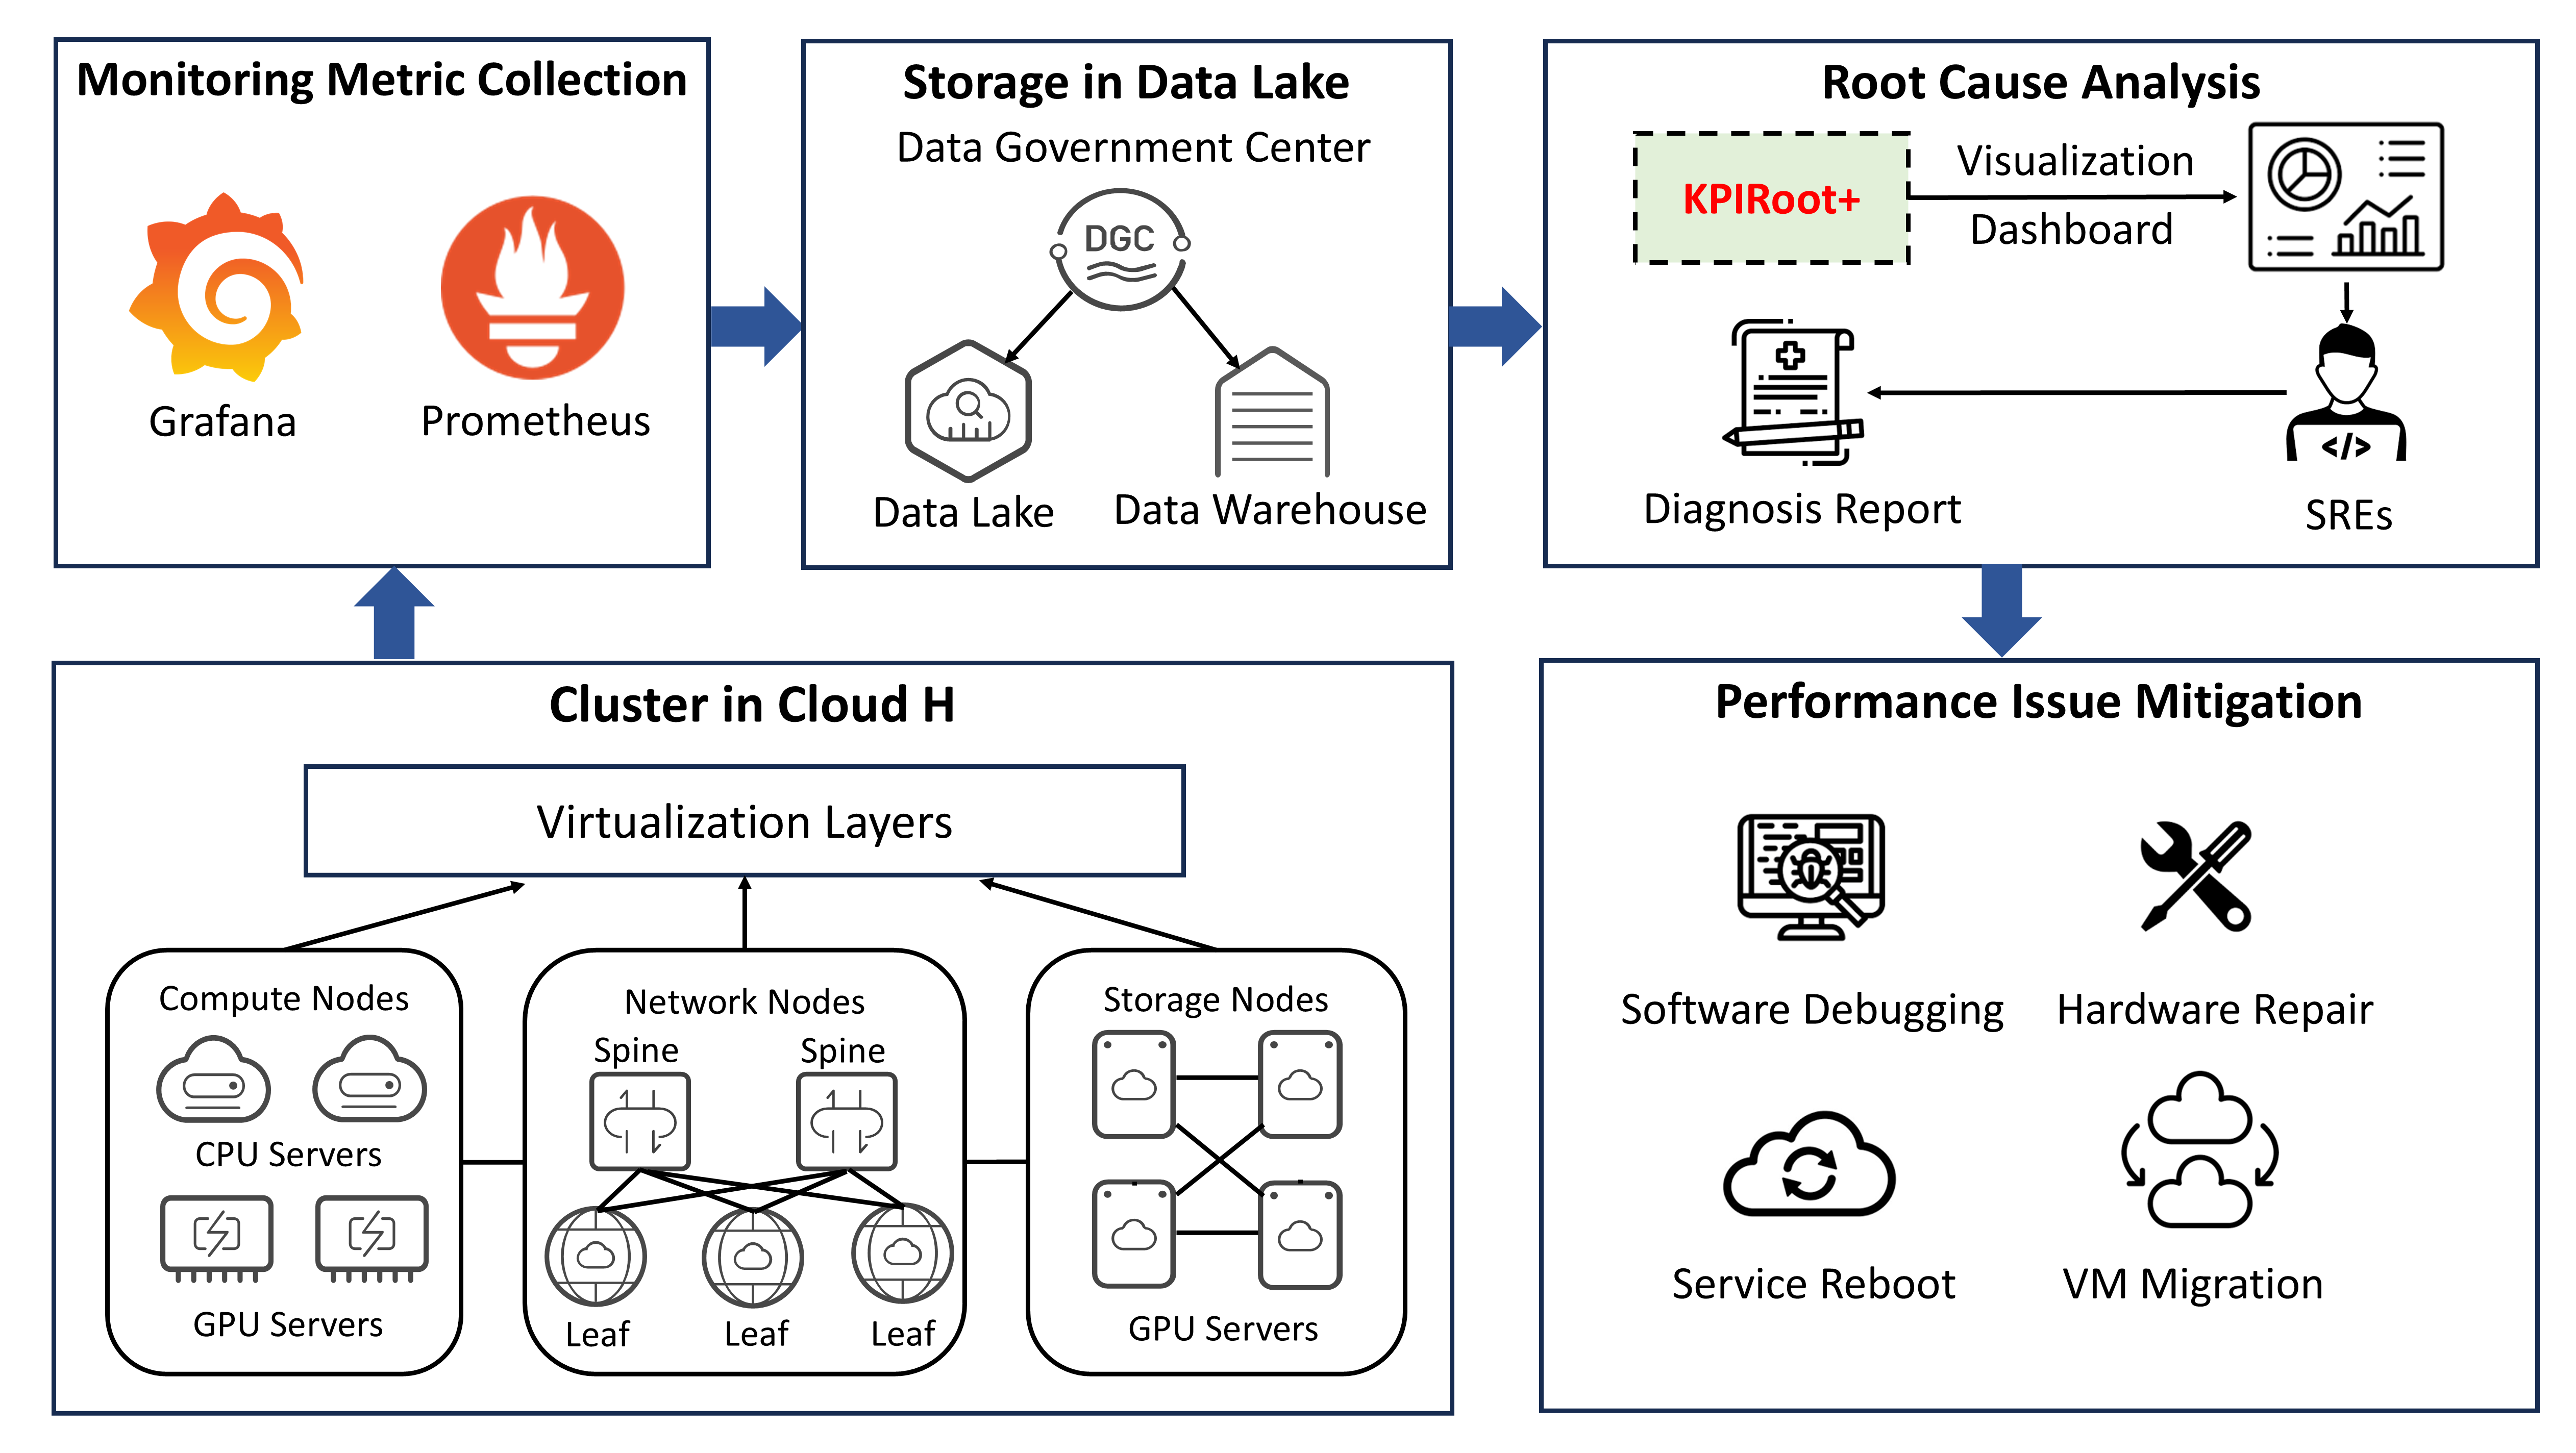
The image depicts a multi-stage workflow for monitoring, analyzing, and mitigating performance issues in a cloud-based Hadoop cluster. The diagram is divided into four interconnected quadrants with directional arrows indicating process flow.
---
## Quadrant 1: Monitoring Metric Collection
**Components:**
1. **Grafana** (🌞 icon) - Monitoring dashboard
2. **Prometheus** (🔥 icon) - Time-series database
**Flow:**
Metrics collected from these tools feed into the Data Lake via a bidirectional arrow.
---
## Quadrant 2: Storage in Data Lake
**Components:**
- **Data Lake** (🌥️ icon) - Raw data repository
- **Data Warehouse** (📄 icon) - Structured data storage
- **Data Governance Center (DGC)** (🌀 icon) - Centralized governance hub
**Connections:**
- DGC connects to both Data Lake and Data Warehouse via bidirectional arrows
- Data Lake receives input from Monitoring Metric Collection
---
## Quadrant 3: Root Cause Analysis
**Components:**
1. **KPIRoot+** (📊 icon) - Key Performance Indicator analysis tool
2. **Visualization Dashboard** (📈 icon) - Real-time monitoring interface
3. **Diagnosis Report** (📋 icon) - Automated analysis output
4. **SREs** (👨💻 icon) - Site Reliability Engineers
**Flow:**
Data from Data Lake/Warehouse → KPIRoot+ → Visualization Dashboard → Diagnosis Report → SREs
---
## Quadrant 4: Performance Issue Mitigation
**Components:**
1. **Software Debugging** (🔍 icon) - Code-level analysis
2. **Hardware Repair** (🔧 icon) - Physical infrastructure maintenance
3. **Service Reboot** (🔄 icon) - Application restart
4. **VM Migration** (☁️ icon) - Virtual machine relocation
**Flow:**
Diagnosis Report → Mitigation actions (all four components)
---
## Cluster Architecture (Bottom Section)
**Virtualization Layers:**
1. **Compute Nodes**
- CPU Servers (💻 icon)
- GPU Servers (🖥️ icon)
2. **Network Nodes**
- Spine (🔗 icon) - Central network hub
- Leaf (🌿 icon) - Edge network nodes
3. **Storage Nodes**
- GPU Servers (🖥️ icon) - High-performance storage
**Topology:**
- Spine connects to multiple Leaf nodes
- Leaf nodes connect to both Compute and Storage Nodes
- GPU Servers appear in both Compute and Storage Nodes sections
---
## Key Observations
1. **Bidirectional Flow:** Data moves between Monitoring Tools and Data Lake
2. **Centralized Governance:** DGC acts as a single point of control
3. **Multi-layered Analysis:** Root Cause Analysis feeds directly into Mitigation
4. **Hardware-Software Integration:** Mitigation options cover both code and infrastructure
5. **GPU Acceleration:** GPU Servers appear in both Compute and Storage layers
---
## Spatial Grounding (Legend)
- **Top-Left Quadrant:** Monitoring Metric Collection
- **Top-Right Quadrant:** Root Cause Analysis
- **Bottom-Left Quadrant:** Cluster Architecture
- **Bottom-Right Quadrant:** Mitigation Options
---
## Language Note
All textual elements are in English. No non-English content detected.
---
## Diagram Structure