## Line Graphs: MHA2MLA and GQA2MLA Training Loss Curves
### Overview
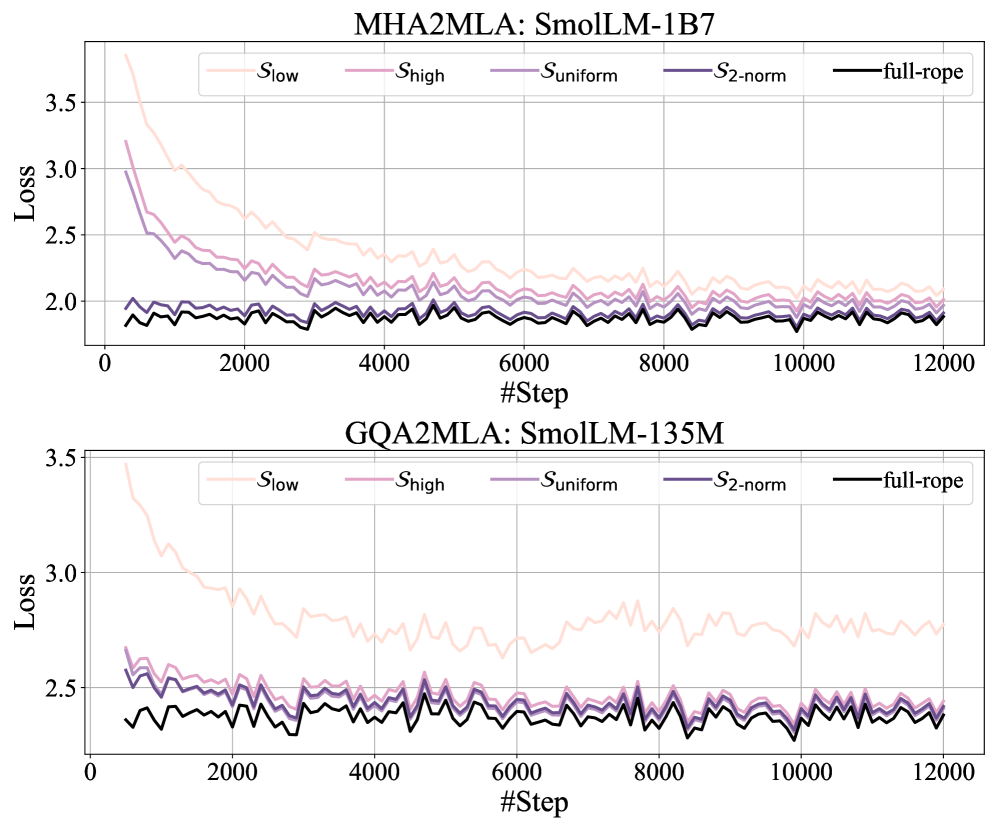
The image contains two line graphs comparing training loss curves for two models: **MHA2MLA (SmolLM-1B7)** and **GQA2MLA (SmolLM-135M)**. Each graph tracks loss values across 12,000 training steps, with five distinct methods represented by colored lines. The y-axis measures loss (2.0–3.5), and the x-axis represents training steps (0–12,000).
### Components/Axes
- **X-axis**: `#Step` (0 to 12,000, linear scale).
- **Y-axis**: `Loss` (2.0 to 3.5, linear scale).
- **Legends**: Positioned at the top of each graph, with five categories:
- `S_low` (light pink, dashed line).
- `S_high` (medium pink, dash-dot line).
- `S_uniform` (light purple, dotted line).
- `S_2-norm` (dark purple, solid line).
- `full-rope` (black, solid line).
### Detailed Analysis
#### MHA2MLA (SmolLM-1B7)
- **S_low**: Starts at ~3.5 loss, sharply declines to ~2.0 by 2,000 steps, then stabilizes with minor fluctuations.
- **S_high**: Begins at ~3.0, decreases to ~2.2 by 2,000 steps, and stabilizes.
- **S_uniform**: Starts at ~2.5, drops to ~2.1 by 2,000 steps, and remains stable.
- **S_2-norm**: Begins at ~2.0, fluctuates slightly but stays near 2.0.
- **full-rope**: Starts at ~1.8, remains the lowest and most stable throughout.
#### GQA2MLA (SmolLM-135M)
- **S_low**: Starts at ~3.5, declines to ~2.5 by 2,000 steps, then fluctuates between 2.4–2.6.
- **S_high**: Begins at ~2.7, drops to ~2.3 by 2,000 steps, and stabilizes.
- **S_uniform**: Starts at ~2.4, fluctuates between 2.2–2.4.
- **S_2-norm**: Begins at ~2.2, fluctuates between 2.0–2.2.
- **full-rope**: Starts at ~1.8, fluctuates slightly but remains the lowest.
### Key Observations
1. **Consistent Performance of `full-rope`**: Across both models, `full-rope` consistently achieves the lowest loss, maintaining stability with minimal fluctuations.
2. **Convergence of Methods**: All methods (except `full-rope`) show a general downward trend in loss, converging toward similar values by 12,000 steps.
3. **Model-Specific Behavior**:
- **MHA2MLA**: Smoother curves with less variability.
- **GQA2MLA**: More pronounced fluctuations, especially for `S_low` and `S_high`.
4. **Initial Loss Values**: `S_low` starts with the highest loss in both models, while `full-rope` begins with the lowest.
### Interpretation
The data suggests that the `full-rope` method is the most effective for minimizing training loss across both models, likely due to its stable and efficient optimization. The other methods (`S_low`, `S_high`, `S_uniform`, `S_2-norm`) exhibit varying degrees of convergence, with `S_low` starting with the highest loss but improving significantly. The smoother curves in MHA2MLA imply more stable training dynamics compared to GQA2MLA, which shows greater variability. These trends highlight the importance of method selection in training efficiency, with `full-rope` emerging as the optimal choice for both models.