## Line Graphs: Performance Metrics with/without LC Reward
### Overview
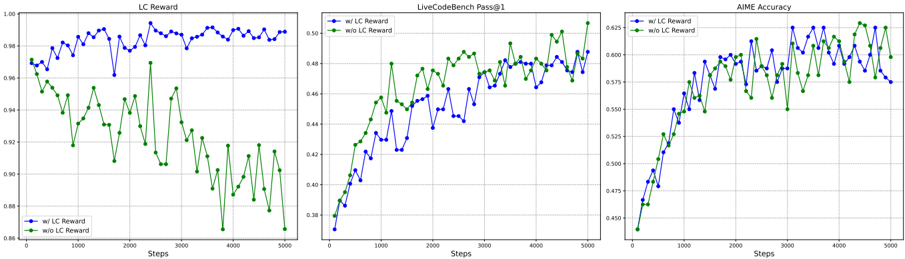
The image contains three line graphs comparing performance metrics across 5,000 steps, with and without LC Reward. Each graph tracks a different metric: LC Reward (left), LiveCodeBench Pass@1 (center), and AIME Accuracy (right). Two data series are plotted per graph: blue for "w/ LC Reward" and green for "w/o LC Reward".
### Components/Axes
1. **X-Axis**: "Steps" (0 to 5,000 in increments of 1,000)
2. **Y-Axes**:
- Left Graph: LC Reward (0.86 to 1.00)
- Center Graph: LiveCodeBench Pass@1 (0.38 to 0.52)
- Right Graph: AIME Accuracy (0.43 to 0.63)
3. **Legends**: Positioned left of each graph, with:
- Blue line: "w/ LC Reward"
- Green line: "w/o LC Reward"
### Detailed Analysis
#### Left Graph (LC Reward)
- **Trend**:
- Blue line ("w/ LC Reward") fluctuates between **0.96–0.99**, peaking at ~0.995 near step 2,500.
- Green line ("w/o LC Reward") declines sharply from **0.97–0.86**, with a steep drop after step 2,000.
- **Key Data Points**:
- Step 0: Blue (0.97), Green (0.97)
- Step 2,500: Blue (~0.995), Green (~0.91)
- Step 5,000: Blue (~0.985), Green (~0.86)
#### Center Graph (LiveCodeBench Pass@1)
- **Trend**:
- Blue line ("w/ LC Reward") rises steadily from **0.38–0.49**, surpassing the green line after step 2,000.
- Green line ("w/o LC Reward") increases gradually from **0.38–0.48**, plateauing near step 4,000.
- **Key Data Points**:
- Step 0: Blue (0.38), Green (0.38)
- Step 2,000: Blue (~0.44), Green (~0.46)
- Step 5,000: Blue (~0.49), Green (~0.48)
#### Right Graph (AIME Accuracy)
- **Trend**:
- Blue line ("w/ LC Reward") starts at **0.43** and rises to **0.62**, with minor fluctuations.
- Green line ("w/o LC Reward") begins at **0.43** and peaks at **0.62**, but remains below the blue line after step 1,000.
- **Key Data Points**:
- Step 0: Blue (0.43), Green (0.43)
- Step 1,000: Blue (~0.55), Green (~0.54)
- Step 5,000: Blue (~0.62), Green (~0.60)
### Key Observations
1. **LC Reward Impact**:
- All metrics show higher performance with LC Reward (blue lines consistently above green lines after initial steps).
2. **Stability vs. Decline**:
- LC Reward maintains stability (left graph), while its absence causes sharp declines (green line drops 0.11 in left graph).
3. **Crossover Points**:
- In the center graph, "w/ LC Reward" overtakes "w/o LC Reward" around step 2,000.
4. **AIME Accuracy**:
- Both series converge at step 5,000 (~0.62 vs. ~0.60), but "w/ LC Reward" maintains a slight edge throughout.
### Interpretation
The data demonstrates that LC Reward significantly improves performance across all metrics:
- **LC Reward Metric**: Directly tracks the reward's value, showing stability with reward vs. decline without.
- **LiveCodeBench Pass@1**: LC Reward accelerates improvement, achieving higher scores after initial steps.
- **AIME Accuracy**: LC Reward sustains higher accuracy, with both series converging only at the final step.
Outliers include the sharp drop in the left graph's green line after step 2,000, suggesting LC Reward prevents performance degradation. The convergence in AIME Accuracy at step 5,000 implies diminishing returns for LC Reward over time, but its absence results in consistently lower outcomes.