## Line Charts: Performance Comparison with and without LC Reward
### Overview
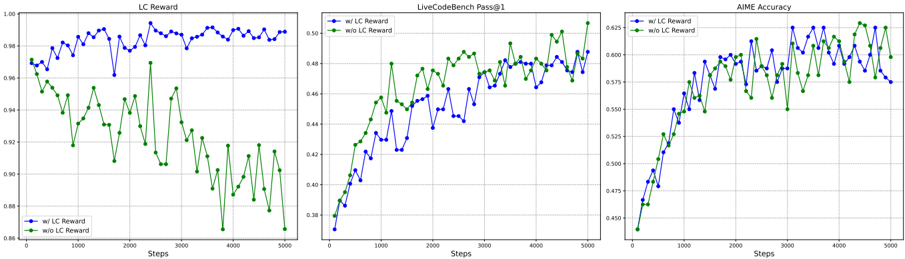
The image presents three line charts comparing the performance of a system with and without "LC Reward" across different metrics: "LC Reward", "LiveCodeBench Pass@1", and "AIME Accuracy". Each chart plots the metric against the number of steps, ranging from 0 to 5000. The charts aim to illustrate the impact of incorporating LC Reward on the system's performance in these three areas.
### Components/Axes
* **X-axis (all charts):** "Steps", ranging from 0 to 5000, with markers at 1000 intervals.
* **Y-axis (LC Reward):** "LC Reward", ranging from 0.86 to 1.00, with markers at 0.02 intervals.
* **Y-axis (LiveCodeBench Pass@1):** "LiveCodeBench Pass@1", ranging from 0.38 to 0.50, with markers at 0.02 intervals.
* **Y-axis (AIME Accuracy):** "AIME Accuracy", ranging from 0.450 to 0.625, with markers at 0.025 intervals.
* **Legend (all charts, top-left):**
* Blue line: "w/ LC Reward" (with LC Reward)
* Green line: "w/o LC Reward" (without LC Reward)
### Detailed Analysis
**1. LC Reward Chart (Left)**
* **Trend (w/ LC Reward - Blue):** The line starts at approximately 0.97, increases to around 0.99 by step 1000, and then fluctuates between 0.98 and 1.00 for the remainder of the steps.
* Step 0: ~0.97
* Step 1000: ~0.99
* Step 5000: ~0.99
* **Trend (w/o LC Reward - Green):** The line starts at approximately 0.97, decreases significantly to around 0.90 by step 4000, and then fluctuates between 0.88 and 0.92 for the remainder of the steps.
* Step 0: ~0.97
* Step 1000: ~0.94
* Step 2000: ~0.91
* Step 3000: ~0.92
* Step 4000: ~0.88
* Step 5000: ~0.90
**2. LiveCodeBench Pass@1 Chart (Center)**
* **Trend (w/ LC Reward - Blue):** The line starts at approximately 0.38, increases to around 0.45 by step 1000, and then fluctuates between 0.42 and 0.47 for the remainder of the steps.
* Step 0: ~0.38
* Step 1000: ~0.43
* Step 5000: ~0.46
* **Trend (w/o LC Reward - Green):** The line starts at approximately 0.45, increases to around 0.48 by step 2000, and then fluctuates between 0.45 and 0.50 for the remainder of the steps.
* Step 0: ~0.38
* Step 1000: ~0.45
* Step 2000: ~0.48
* Step 5000: ~0.49
**3. AIME Accuracy Chart (Right)**
* **Trend (w/ LC Reward - Blue):** The line starts at approximately 0.45, increases to around 0.58 by step 2000, and then fluctuates between 0.57 and 0.61 for the remainder of the steps.
* Step 0: ~0.45
* Step 1000: ~0.52
* Step 2000: ~0.58
* Step 5000: ~0.58
* **Trend (w/o LC Reward - Green):** The line starts at approximately 0.45, increases to around 0.60 by step 3000, and then fluctuates between 0.58 and 0.63 for the remainder of the steps.
* Step 0: ~0.45
* Step 1000: ~0.53
* Step 2000: ~0.57
* Step 3000: ~0.61
* Step 5000: ~0.62
### Key Observations
* In the "LC Reward" chart, the system performs significantly better with LC Reward, maintaining a high reward value throughout the steps, while the reward decreases significantly without LC Reward.
* In the "LiveCodeBench Pass@1" chart, the system performs better without LC Reward, especially after 2000 steps.
* In the "AIME Accuracy" chart, the system performs slightly better without LC Reward, especially after 3000 steps.
### Interpretation
The charts suggest that the impact of LC Reward varies depending on the specific metric being evaluated. While LC Reward is highly beneficial for maintaining a high "LC Reward" value, it appears to have a negative or negligible impact on "LiveCodeBench Pass@1" and "AIME Accuracy". This could indicate that optimizing for LC Reward might come at the expense of performance in other areas. The data suggests that the system's performance is more balanced without LC Reward, achieving higher "LiveCodeBench Pass@1" and "AIME Accuracy" scores. Further investigation is needed to understand the trade-offs and optimize the system for overall performance across all metrics.