## Line Charts: Training Performance Comparison
### Overview
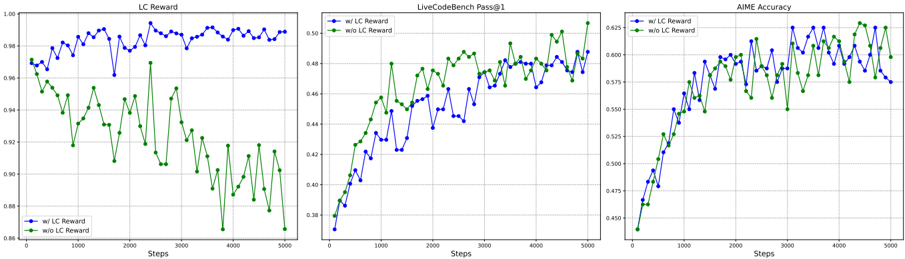
The image presents three line charts, arranged horizontally, comparing the performance of a model with and without "LC Reward" across different metrics: "LC Reward", "LiveCodeBench Pass@1", and "AIME Accuracy". All charts share a common x-axis representing "Steps" from 0 to 5000. The y-axes vary depending on the metric.
### Components/Axes
* **X-axis (all charts):** "Steps" (0 to 5000, with increments of 500)
* **Chart 1:**
* **Title:** "LC Reward"
* **Y-axis:** Scale from approximately 0.88 to 1.00, with increments of 0.02.
* **Chart 2:**
* **Title:** "LiveCodeBench Pass@1"
* **Y-axis:** Scale from approximately 0.38 to 0.50, with increments of 0.02.
* **Chart 3:**
* **Title:** "AIME Accuracy"
* **Y-axis:** Scale from approximately 0.45 to 0.625, with increments of 0.05.
* **Legend (all charts, bottom-left):**
* Blue Line: "w/ LC Reward"
* Green Line: "w/o LC Reward"
### Detailed Analysis or Content Details
**Chart 1: LC Reward**
* **Blue Line ("w/ LC Reward"):** Starts at approximately 0.98 at Step 0, fluctuates between approximately 0.96 and 0.99, with a slight downward trend initially, then stabilizes around 0.97-0.98. There are several dips below 0.96, but it recovers.
* Step 0: ~0.98
* Step 500: ~0.96
* Step 1000: ~0.96
* Step 1500: ~0.97
* Step 2000: ~0.97
* Step 2500: ~0.97
* Step 3000: ~0.97
* Step 3500: ~0.97
* Step 4000: ~0.97
* Step 4500: ~0.97
* Step 5000: ~0.97
* **Green Line ("w/o LC Reward"):** Starts at approximately 0.94 at Step 0, exhibits a significant downward trend, reaching a minimum of approximately 0.88 around Step 2000, then shows a slight recovery, ending around 0.90 at Step 5000.
* Step 0: ~0.94
* Step 500: ~0.92
* Step 1000: ~0.90
* Step 1500: ~0.89
* Step 2000: ~0.88
* Step 2500: ~0.89
* Step 3000: ~0.90
* Step 3500: ~0.91
* Step 4000: ~0.91
* Step 4500: ~0.91
* Step 5000: ~0.90
**Chart 2: LiveCodeBench Pass@1**
* **Blue Line ("w/ LC Reward"):** Starts at approximately 0.41 at Step 0, shows a consistent upward trend, reaching a peak of approximately 0.49 around Step 4000, then slightly decreases to approximately 0.48 at Step 5000.
* Step 0: ~0.41
* Step 500: ~0.43
* Step 1000: ~0.45
* Step 1500: ~0.46
* Step 2000: ~0.47
* Step 2500: ~0.48
* Step 3000: ~0.48
* Step 3500: ~0.49
* Step 4000: ~0.49
* Step 4500: ~0.48
* Step 5000: ~0.48
* **Green Line ("w/o LC Reward"):** Starts at approximately 0.38 at Step 0, also shows an upward trend, but is consistently lower than the blue line. It reaches a peak of approximately 0.46 around Step 4000 and ends at approximately 0.45 at Step 5000.
* Step 0: ~0.38
* Step 500: ~0.40
* Step 1000: ~0.42
* Step 1500: ~0.43
* Step 2000: ~0.44
* Step 2500: ~0.45
* Step 3000: ~0.45
* Step 3500: ~0.46
* Step 4000: ~0.46
* Step 4500: ~0.46
* Step 5000: ~0.45
**Chart 3: AIME Accuracy**
* **Blue Line ("w/ LC Reward"):** Starts at approximately 0.47 at Step 0, exhibits a generally upward trend, fluctuating between approximately 0.58 and 0.62.
* Step 0: ~0.47
* Step 500: ~0.52
* Step 1000: ~0.56
* Step 1500: ~0.58
* Step 2000: ~0.59
* Step 2500: ~0.60
* Step 3000: ~0.61
* Step 3500: ~0.61
* Step 4000: ~0.61
* Step 4500: ~0.61
* Step 5000: ~0.60
* **Green Line ("w/o LC Reward"):** Starts at approximately 0.45 at Step 0, also shows an upward trend, but is consistently lower than the blue line. It reaches a peak of approximately 0.57 around Step 3500 and ends at approximately 0.56 at Step 5000.
* Step 0: ~0.45
* Step 500: ~0.49
* Step 1000: ~0.53
* Step 1500: ~0.55
* Step 2000: ~0.56
* Step 2500: ~0.56
* Step 3000: ~0.57
* Step 3500: ~0.57
* Step 4000: ~0.57
* Step 4500: ~0.56
* Step 5000: ~0.56
### Key Observations
* Across all three metrics, the model *with* "LC Reward" consistently outperforms the model *without* "LC Reward".
* The "LC Reward" metric itself shows a clear divergence between the two models, with the model without "LC Reward" experiencing a significant decline over time.
* The "LiveCodeBench Pass@1" and "AIME Accuracy" metrics show more gradual improvements, but the performance gap between the two models remains consistent.
* The fluctuations in all lines suggest some level of variance in the training process.
### Interpretation
The data strongly suggests that incorporating "LC Reward" into the training process significantly improves the model's performance across all evaluated metrics. The "LC Reward" metric itself indicates that the reward signal is being effectively learned by the model with the reward mechanism, while the improvements in "LiveCodeBench Pass@1" and "AIME Accuracy" demonstrate that this learning translates to better generalization and performance on downstream tasks. The consistent outperformance of the model with "LC Reward" suggests that this reward signal is a valuable component of the training process. The fluctuations observed in the lines likely represent the stochastic nature of the training process and the inherent variability in the data. The divergence in the LC Reward chart is particularly striking, indicating that the LC Reward is actively being optimized when present, and degrades when absent. This suggests a strong correlation between the LC Reward and the overall training process.