## Scatter Plot: international_law
### Overview
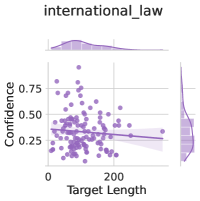
The image is a scatter plot titled "international_law". It displays the relationship between "Target Length" on the x-axis and "Confidence" on the y-axis. The plot includes a regression line with a confidence interval. Histograms are displayed along the top and right edges, showing the distributions of Target Length and Confidence, respectively.
### Components/Axes
* **Title:** international\_law
* **X-axis:** Target Length
* Scale ranges from 0 to approximately 200.
* **Y-axis:** Confidence
* Scale ranges from 0 to 0.75.
* **Data Points:** Purple dots representing individual data points.
* **Regression Line:** A purple line showing the linear regression fit to the data.
* **Confidence Interval:** A shaded purple area around the regression line, representing the confidence interval.
* **Histograms:**
* Top: Distribution of Target Length.
* Right: Distribution of Confidence.
### Detailed Analysis
* **Target Length:**
* Ranges from approximately 0 to 200.
* The distribution, as shown by the histogram, appears to be skewed right, with a higher concentration of shorter target lengths.
* **Confidence:**
* Ranges from approximately 0 to 0.75.
* The distribution, as shown by the histogram, appears to be somewhat uniform, with a slight peak around 0.25.
* **Data Points:**
* The data points are scattered across the plot.
* There is a higher concentration of points with lower target lengths and confidence values between 0.25 and 0.5.
* **Regression Line:**
* The regression line has a slight negative slope, indicating a weak negative correlation between Target Length and Confidence.
* **Confidence Interval:**
* The confidence interval widens at the extremes of the Target Length range, indicating greater uncertainty in the regression fit at those points.
### Key Observations
* There is a weak negative correlation between Target Length and Confidence.
* The majority of data points are clustered at lower target lengths.
* The confidence interval widens at the extremes of the Target Length range.
### Interpretation
The scatter plot suggests that, for the "international_law" category, there is a slight tendency for confidence to decrease as the target length increases. However, the correlation is weak, and the confidence interval is relatively wide, indicating that the relationship is not very strong. The clustering of data points at lower target lengths suggests that shorter targets are more common in this category. The widening of the confidence interval at the extremes of the Target Length range indicates that the regression fit is less reliable for very short or very long targets.